
Gao Juan
Canvard College, Beijing Technology and Business University, 101118, Beijing, China
Information Technology Journal
Year: 2014 | Volume: 13 | Issue: 11 | Page No.: 1843-1847


ABSTRACT
Combining the characteristics of group-purchase websites, this study brings forward the hypotheses of customer perceived value constructs and measuring indexes, using the approaches of literature studies and depth interview and so on. Then, a primary evaluation model of customer perceived value is set up. Abundant data is collected and processed by SPSS 16.0. Finally, this study constructs a scientific evaluation model of customer perceived value of group buying, so as to contribute to the enhancement of customer perceived value in the website. It may help all kinds of group-buying websites to realize the win-win situation with customers.
PDF Abstract XML References Citation
Received: June 26, 2013;
Accepted: August 12, 2013;
Published: April 18, 2014
How to cite this article
Gao Juan, 2014. Study on Customer Perceived Value of Online Group Purchase in Beijing. Information Technology Journal, 13: 1843-1847.
DOI: 10.3923/itj.2014.1843.1847
URL: https://scialert.net/abstract/?doi=itj.2014.1843.1847
DOI: 10.3923/itj.2014.1843.1847
URL: https://scialert.net/abstract/?doi=itj.2014.1843.1847
INTRODUCTION
In January 2013, the group purchase navigation website tuan 800.com released "the 2012 China group purchase market statistics report". With continuous monitoring of the ten domestic mainstream group-buying websites, the total turnover in 2012 was 21,390,000,000 yuan, year-on-year growth of 93% (Ying, 2012). With the boom of online group purchase, many scholars got interested in this business model. Kauffman is one of scholars who initially started to study online group purchase in the world; his research direction is the difference between online group purchase and fixed price mechanism, analysis of how the price impacts consumer behavior in online group purchase. In China, (Li, 2006) studied the buyer and the seller in online group buying in term of game theory (Zhao and Zhao, 2006) selected fleeing goods in group purchase to analyze; Li (2007) evaluated and discussed the emergence and development, the characteristics and advantages of online group purchase in macroscopic view. In term of the websites offering group-purchase service, the most important thing is how to provide service of higher-quality to customers coming for cheap goods and then attract them to consume again. The aim of studying customer perceived value of online group purchase in Beijing is to help such websites obtain the competitive advantages and enhance consumer loyalty.
RESEARCH METHODOLOGY
Desk research survey, questionnaire survey and quantitative analysis are used in this study. Desk research survey helps construct the initial model of customer perceived value of online group purchase; questionnaire survey was used to get first-hand data on group purchase; quantitative analysis in the study mainly refers to factor analysis, which is used to analyze the first-hand data and test the initial model and then confirm the logical components of customer perceived value about online group purchase.
HYPOTHESES OF CUSTOMER PERCEIVED VALUE CONSTRUCTS
Many empirical studies have shown that customer perceived value is the direct cause of the consumer behavior. In the study a model of customer perceived value is constructed, as showed in Fig. 1.
In the models, the customer perceived value is divided into two parts, the first part is the value transferred to customer by enterprise, another part is the value passed between the customers. Considering the characteristics of online group purchase, word of mouth is the most important means spread customer value (Li, 2010).
SURVEY SCHEME AND DATA ANALYSIS
About questionnaire: The questionnaire is divided into two parts in total. The first part mainly explores consumers' expectation and attention to each component of perceived value and all the problems are positive questions (Table 1:“Specific question”), using 5 rating Likert scale (from 1 to 5 is very unimportant to very important successively). The second part is a survey of respondents’ profile, including gender, age, income, education and merchandise types of online group purchase.
Basic situation of samples: In 2011 January, 300 questionnaires were handed out in Beijing to university student and white-collar workers who had online group purchase experiences.
 | |
| Fig. 1: | Model of customer perceived value in the first purchase |
| Table 1: | Components of customer perceived value and the specific questions |
 | |
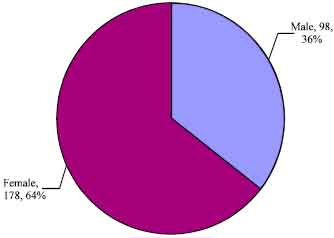 | |
| Fig. 2: | Gender distribution |
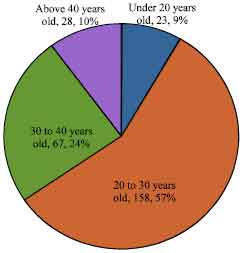 | |
| Fig. 3: | Age distribution |
There are 276 valid questionnaires altogether, including 98 male and 178 female, accounting to 36 and 64%, respectively, as shown in Fig. 2. About age distribution, 23 people are under 20 years old, 158 are between 20 to 30 years old, 67 are between 30 to 40 years old and 28 are above 40 years old, as shown in Fig. 3. About education background distribution, persons having a bachelor's degree and graduate degrees account for the most, 59 and 35%, respectively, as shown in Fig. 4. About monthly income distribution, about 50% people earn between 2000 to 4999 Renminbi, as shown in Fig. 5. About merchandise types of online group purchase, more than 70% had bought more than three types, as shown in Fig. 6.
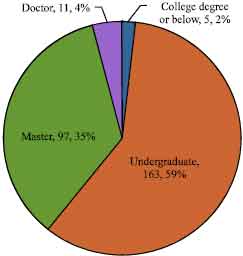 | |
| Fig. 4: | Education background distribution |
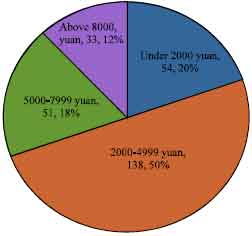 | |
| Fig. 5: | Monthly income distribution |
This study has similar sampling distributions with the 2012 survey released by 100ec.cn (CECRC, 2013), which shows that white-collar employees contribute half to online group purchase, 25 to 29 year-old people account for 45%, persons with bachelor degree occupy the highest proportion.
Descriptive statistics analysis: Before factor analysis, this study use descriptive statistics analysis to give a whole profile of data.
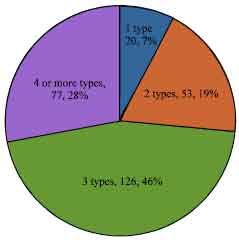 | |
| Fig. 6: | Merchandise types of online group purchase |
| Table 2: | Weight of perceived value components |
 | |
The five rating scale is adopted, 1 very unimportant, 5 very important. The top 6 consumers think important are: The quality of product (mean 4.68, SD 0.543), the existence of recessive consumption (mean 4.61, SD 0.556), the price (mean 4.56, SD 0.539 (the payment security (mean 4.55, SD 0.557) the identity of online group purchase from colleagues (mean 4.53, SD 0.654), participating in group purchase will enable me to better communicate with other people (mean 4.52, SD 0.625).
Reliability of the questionnaire: This study mainly uses Alpha reliability analysis method by SPSS. The reliability coefficients of the original 7 components (product value, service value, social value, emotional value, perceived risk, monetary cost and non-monetary cost) were more than 0.7, which showed that the indexes of each factor in the questionnaire have good internal consistency.
Factor analysis: Before factor analysis, it is need to test whether the original variables are relevant and whether it is suitable for factor analysis. This study uses Bartlett’s test and KMO (Kaiser-Meyer-Olkin index) to examine. If KMO is greater than 0.5 or the significance of Bartlett’s test is less than 0.5, factor analysis can be used. In this study the value of KMO is 0.769, the significance of Bartlett’s test is 0.000, which shows that the correlation of data is relatively high and it is suitable for factor analysis.
In the process of using SPSS for factor analysis, variable communality is also need to measure. If the communality is more than 0.5, it shows that common factors can reflect most information of the variables. For the communalities of all the items are greater than 0.5, the items are significant (Table 1: “Communalities”).
This study uses principal component analysis to extract the factors. The main rotation method is varimax procedure. The rotated component matrix is omitted due to space problems. By factor analysis, the items distribution focused obviously on 9 components. Brand value and feeling value are two new items (see appendix Table 1:“item”).
Weight definition of each component: We referred to some research results of Shanghai academy of quality management to determine the weight of the 9 factors. It is based on survey data. The factor loading is a parameter to compute the weights, as shown below:
Qi = Ci2/ΣCj2 (j = 1 ... ... ... .k)
Among them, Qi is the weight of each component, Ci2 is the quadratic sum of factor loads of the ith item, Cj2 is the quadratic sum of factor loads of the jth item and K is the quantity of all items.
By calculating, the weight of each component of customer perceived value is shown in Table 2.
CONCLUSION
As it is shown above, the customer perceived value system of online group purchase is composed of two dimensions of 9 factors in 30 items. In the 9 factors, the proportion of product value is the highest, for 15.68%, followed by the monetary cost; the proportion is 14.36%, which indicates that the consumers still value the product itself and the price level. The weight of perceived risk is third with 12.83%, indicating that to the current group purchase consumers have much mistrust. In addition, the online group purchase consumers also think a lot of the service value and the social value. Group-buying website may formulate feasible schemes to improve customer perceived value on the basis of the strategic direction, which will help to strengthen customer relationship, promote rebury of products, so as to realize the win-win situation between the website and customers.