
A.S. Al-Farraj
Department of Soil Sciences, College of Food and Agriculture Sciences,King Saud University, P.O. Box 2460, Riyadh 11451, Saudi Arabia
Journal of Agronomy
Year: 2008 | Volume: 7 | Issue: 2 | Page No.: 115-126


ABSTRACT
Because of very limited information of the clay minerals of Southern Jazan region (Saudi Arabia), the mineralogy of the clay fraction has been studied. A total of nineteen soil samples from five sites representing the main landforms in the region were studied. X-ray diffraction, differential thermal and thermo gravimetric analyses were carried out on the samples. Smectite, kaolinite and illite were found to be the predominant soil minerals. Other minerals present in small quantities included: Chlorite, quartz, feldspars. DTA confirmed the low hydroxylation temperatures of kaolinite (513-540°C), which indicates disordered crystallization of kaolinite. Moreover, TGA illustrated 4-6.6% (average 5.4%) weight loss related to dehydroxylation of kaolinite. Therefore, the amount of kaolinite minerals was calculated to be 29-47% with average 39%. The clay minerals in the samples were similarity among all the sites and this could be explained by the fact that arid conditions found in the area does not support intense pedogenic processes.
PDF Abstract XML References Citation
How to cite this article
A.S. Al-Farraj, 2008. The Mineralogy of Clay Fractions in the Soils of the Southern Region of Jazan, Saudi Arabia. Journal of Agronomy, 7: 115-126.
DOI: 10.3923/ja.2008.115.126
URL: https://scialert.net/abstract/?doi=ja.2008.115.126
DOI: 10.3923/ja.2008.115.126
URL: https://scialert.net/abstract/?doi=ja.2008.115.126
INTRODUCTION
Jazan region is located in the south west part of Saudi Arabia (E: 42.0°-43.8° and N: 16.5°-17.0°). It`s area is 13,500 km2. Jazan region is part of Arabia shield which is a part of the Precambrian crustal plate and consists of igneous and metamorphic rocks. The dominant rocks are granite, basalts, diorite, gabro and mica-schist. During the Tertiary period, the shield was separated from the adjacent African shield by a rift of earth`s crust that currently occupied by the red sea. Sedimentary coastal plain has formed on the area between the escarpment of the shield and the red sea (Chapman, 1978). The climate of the Jazan region is considered arid with annual mean temperature 28°C, relative humidity 62% and annual precipitation 62 mm (Anonymous, 1995).
The landforms, developed in Jazan region, are mainly of alluvial nature, formed as a result of the downward transportation of soil material from the highlands by the many valleys and drainage channels that drain out in the sea. Moreover, Jazan embodies variant landforms such as marshland, coastal plain, alluvial plain and valleys (Anonymous, 1995).
The chemical and mineralogical compositions of soil have a particular influence on properties of soils. Therefore, analysis of clay minerals has been widely used to characterize soils. For example, smectite minerals are more dispersible than kaolinite (Goldberg and Glaubig, 1987). Consequently, Kaolinitic soils have the greatest structural stability, water permeability, the biomass productivity and the less erosion comparing with the montmorillonitic soils (Wakindiki and Ben-Hur, 2002). Shainberg and Singer (1990) showed that dispersion and deposition of swelling clays in narrow necks of conducting pores reduced the soils hydraulic conductivity. It is also known that the cation adsorption increases with increasing contents of fine particles and the amount of 2:1 minerals (Schulze, 1989).
In studies of Al-Sarwat mountain (East of Jazan), Al-Arifi (1992) found the dominant mineral is kaolinite in soils has very well infiltration while montmorillonite is the dominant clay mineral in sedimentary soils. The same trend was observed by Oversheet et al. (1977). They found kaolinite as the dominant clay mineral, illite as minor and low crystallization of smectite. Additionally, Al-Arifi (1992) reported smectite, chlorite-like, illite, low crystallization of kaolinite in Al-Darb soil which is in the northern part of Jazan region. However, theses studies were from pedological point of view. Moreover, they based on X-ray diffraction data. Therefore, very limited information is available on the clay mineralogy of Jazan soils. This research concerns a first regional study of the clay minerals of Jazan soils and aims to provide some insight into the range of clay mineral assemblages that may be encountered in south of Jazan region and environment.
MATERIALS AND METHODS
Study area and collection of soil samples: During 2005-2006, samples were collected from 5 soil profiles represented some land forms (Marshland, valleys, pediplains and alluvial plains) of Jazan, south west of Saudi Arabia (Fig. 1). For the purpose of the mineralogical, chemical and physical analyses, soil samples were taken from various depths of soil profiles (Table 1). The samples were mixed to ensure homogeneity, dried at room temperature and gently ground to pass through a 2 mm sieve.
 | |
| Fig. 1: | (A) Map of Saudi Arabia; (B) Map of the study area (South of Jazan region) and the locations of the soil profiles: (1) pediplain with deep soils, (2) alluvial plain, (5) pediplain with shallow soil, (3) marshland and (4) valley |
| Table 1: | Basic physicochemical properties of studied soil samples |
 | |
Chemical and physical analysis: Soil pH and EC were measured of soil paste after equilibration for 24 h. (Thomas, 1996; Rhoades, 1996). Cations and anions (Ca++, Mg++, Na+, K+, HCO3–, CO3=, Cl–, SO4=) were analyzed in those extracted soil solutions (Richards, 1954; Rainwater and Thatcher, 1979). Particle size distribution was determined by the hydrometer method (Gee and Bauder, 1994). Content of CaCO3 was determined by calcimeter method (Loeppert and Suarez, 1996). Soil organic matter of the soil samples were determined by digested them using concentrated H2SO4 (Nelson and Sommers, 1996).
Mineralogical analyses: Soil samples were treated chemically prior to particle size fractionation. Soluble salts and carbonates were removed by using the sodium acetate buffer method (Kunze and Dixon, 1994). Organic matter was removed by using H2O2 (Moore and Reynolds, 1997). Finally, free iron oxides were removed by using dithionite c itrate-sodium bicarbonate (Kunze and Dixon, 1994). After chemical treatment, soil suspensions were dispersed by a combination of chemical and physical methods using Na-hexametaphosphate. Subsequently, a 5 min mixing with a standard electrical mixer was performed (Gee and Bauder, 1994). All clay fractions of soil samples were examined by using X-Ray Diffraction (XRD); clay was oriented by using the glass slide method (Moore and Reynolds, 1997). Samples of clay fractions were saturated by Mg and K and subjected to 550°C heating (K slides) and glycolation (Mg slides) procedures. Samples were subjected to XRD using CuKα (1.5406 A°) radiation (45 kV, 35 mA) on a Philips (PW 1730) vertical goniometer in a range of 2° 2θ to 32° 2θ or from 2° 2θ to 16° 2θ (Whittig and Allardice, 1994).
Differential Thermal Analysis (DTA) and Thermo Gravimetric Analysis (TGA) were carried out with the clay fraction (<0.002 mm) of the soil samples. Precalcined alumina was used as the inert material. Analyses were carried out by DTG 60H with a heating rate of 20°C min–1 from 25 to 1100°C in N. Weight of clay samples were around 25 mg.
RESULTS AND DISCUSSION
The basic physicochemical properties of studied soil samples are shown in Table 1. The texture of soil samples were sandy loam in profiles 1, 2 and 3 and loamy sand at depth 50-80 cm of profile 3, whereas, profiles 4 and 5 had loamy sand and silt loam in general. Alkalinity was moderate, with pH values from 6.8 to 8.4 and average of 7.8.
The mean abundance of water-soluble bases decreased in the order: Ca2+ > Mg2+ > Na+ >> K+, indicating that water-soluble minerals were mainly Ca then Mg and Na salts. Water-soluble anions were predominantly Cl– followed by SO4= then HCO3–. A high amount of SO4= in some profiles suggested that these ions were dissolved from gypsum mineral. The cations and anions that form soluble salts come from dissolved minerals as they weather. Most of the soluble salts remain in the soil, if precipitation is too low to provide leaching water. When water evaporates from the soil surface, the salts move towards the surface and remain within the soil. Incoming waters transport more dissolved salts and sediments develop with high salt concentrations.
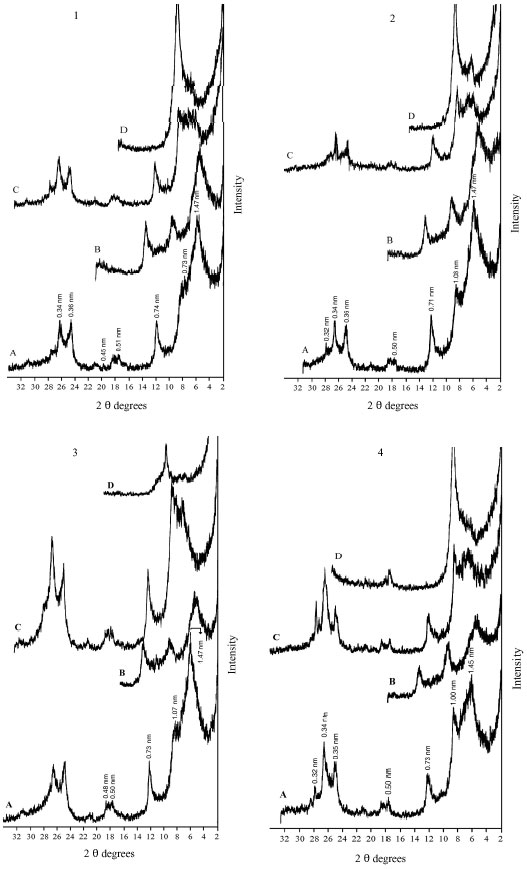
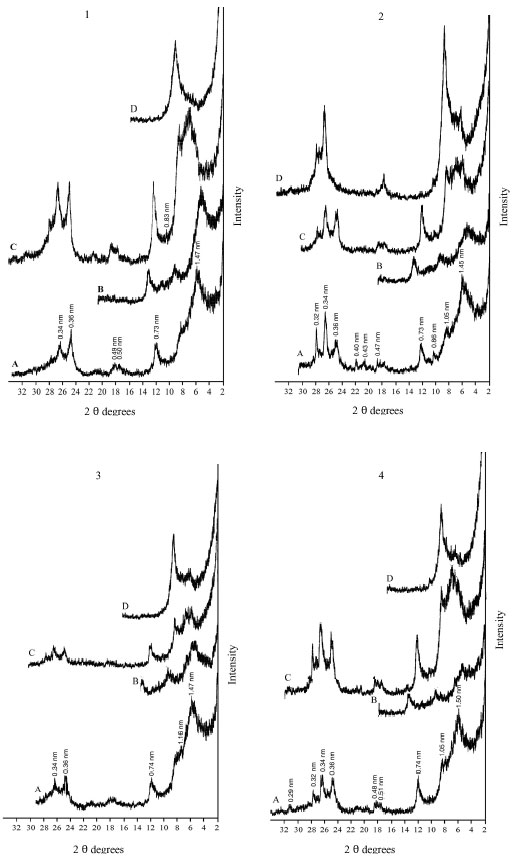
The XRD diagrams indicate the presence of smectite, kaolinite and illite (Fig. 2-6). The XRD patterns show that the clay samples have well-defined peaks in the 1.4-1.5 nm (001) region, which expand after being treated with ethylene glycol to 1.6-1.8 nm. Moreover, treatment of K shifted the 1.4 nm spacing between 1.24-1.28 nm. This confirmed that swelling-lattice smectite is one component present (Moore and Reynolds, 1997).
Kaolinite can be identified through its common 0.72-0.75, 0.36 and 0.44 nm peaks (Moore and Reynolds, 1997). The diffractograms of clay samples show the 001 and 002 reflections of kaolinite at ≈0.72 and ≈0.35 nm, respectively. These reflections disappeared after heating at 550°C, due the of loose of crystalline character of kaolinite (Fig. 2-6). Illite is recognized by a first order basal reflection at 1.0 nm, which remains unchanged by thermal, KCl- and ethylene glycol treatments. Illite minerals also have moderate ≈0.5 nm (002) reflection (Moore and Reynolds, 1997). Grim (1968) reported that reflection (002) is strong with dioctahedral type of illite while for the trioctahedral forms, (002) is weak or absent. In the present study, dioctahedral illite is assumed to be present.
Chlorites rich in iron provide relatively weak ≈1.4 nm (001) and 0.47-0.48 nm (003) reflections and strong ≈ 0.71 nm (002) and 0.36 nm (004) reflections. Therefore, Fe-rich chlorite is readily confused with kaolinite. But after heating at 550°C, diffraction of chlorite appears particular at ≈ 0.71 nm and 0.36 nm (Moore and Reynolds, 1997). In our study, a small peak around 0.71 nm was observed with heating treatment. Thus, chlorite might be suggested to be rare, only occurring in traces. From above, the XRD patterns of clay fractions indicate a similar mineralogical composition of all investigated soil. All soil samples contain kaolinite, smectite and illite. Low amount of chlorite was found in some of the soil samples. Furthermore, accessory minerals such as quartz and feldspars were detected in bulk clay samples (Fig. 2-6). The quartz reflection appeared at 0.34 nm, while reflection of feldspar appeared around 0.32 nm (Moore and Reynolds, 1997).
The DTA signal exhibits a large endothermic peak at 120-140°C due to the removal of adsorbed cations and hydration of the exchangeable cation from the clay minerals. These clay minerals could be smectite and/or illite (Borchardt, 1989; Fanning et al., 1989). On the TGA curves (Fig. 7-11) a 5-15.4% (with average 9.3%) weight loss was determined associated with that endothermic peak. Clay samples of profile 2 gave the highest weight loss (11-15.4%) (Fig. 8). The high intensity of the first peak confirms a higher presence of smectite than in other profiles. The patterns of XRD support this result. Figure 3 shows the high intensity of smectite (001) of the profile 2 comparison with other profiles.
An endothermic peak was observed at 513-540°C. This peak is associated with dehydroxylation of kaolinite. The dehydroxylation temperatures of all the studied samples were ≤540°C. These temperatures are in the upper range of the usually reported temperatures of dehydroxylation of soil kaolins. They are often reported to be around or even below 500°C (Melo et al., 2001; Hart et al., 2002, 2003) while those of reference kaolinites often are between 500 and 550°C (Hart et al., 2002). The size of the peak, as well as the peak temperature, is reduced slightly as the particle size decreases and as the crystallinity decreases. The difference seems to be greater for the crystallinity factor than for the particle size (Grim, 1968). The crystallinity of kaolinite has been found to be associated with pedo-environmental factors of soil. For example, the presence of interstratified 2:1 minerals and Fe in kaolinite is considered to be responsible for decreasing kaolinite crystallinity (Singh and Gilkes, 1992).
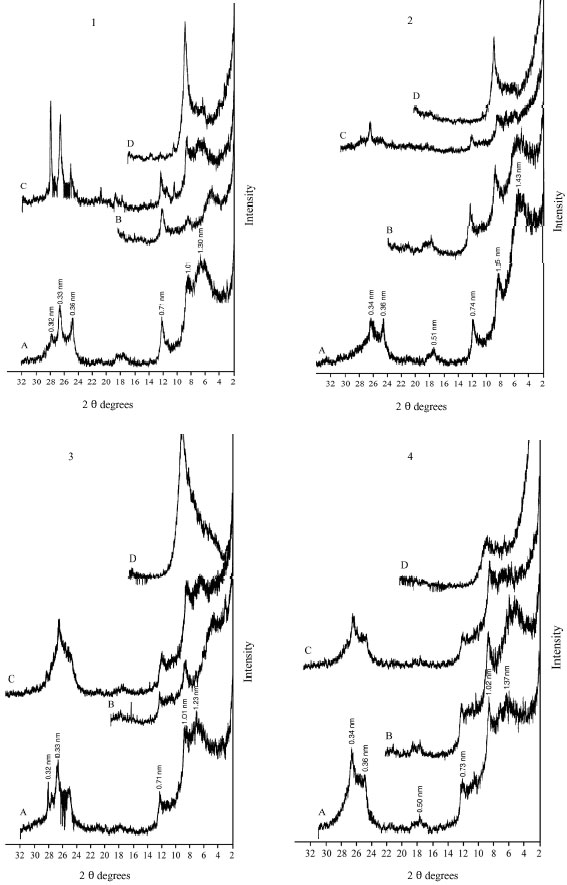 | |
| Fig. 2: | XRD analysis of clay fraction of profile 1; at depths: (1) 0-20; (2) 20-50; (3) 50-70; (4) 70-105 cm. Whereas: (A) Mg; (B) Mg-EG, (C) K treatment and (D) K 550°C |
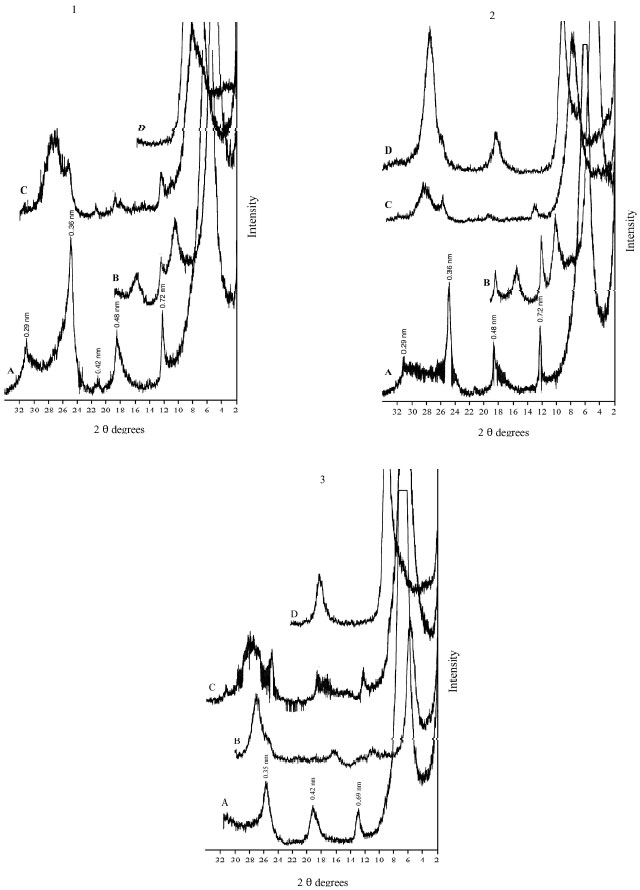 | |
| Fig. 3: | XRD analysis of clay fraction of profile 2; at depths: (1) 0-33, (2) 33-60, (3) 60-75 cm. Whereas: (A) Mg; (B) Mg-EG, (C) K treatment and (D) K 550°C |
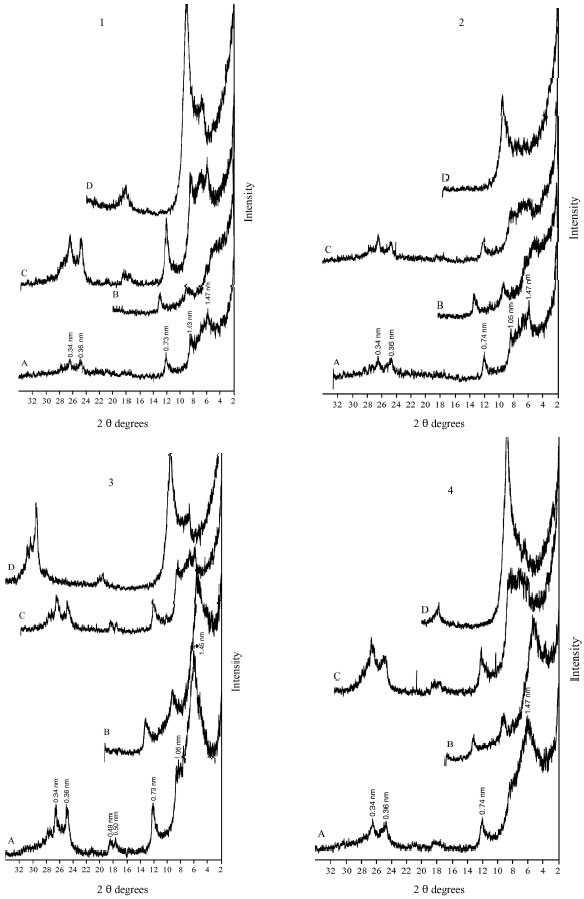 | |
| Fig. 4: | XRD analysis of clay fraction of profile 3; at depths: (1) 0-8, (2) 8-25, (3) 25-50, (4) 50-80 cm. Whereas: (A) Mg, (B) Mg-EG, (C) K treatment and (D) K 550°C |
 | |
| Fig. 5: | XRD analysis of clay fraction of profile 4; at depths: (1) 0-15, (2) 15-50, (3) 50-75, (4) 75-105 cm. Whereas: (A) Mg, (B) Mg-EG, (C) K treatment and (D) K 550°C |
 | |
| Fig. 6: | XRD analysis of clay fraction of profile 5; at depths: (1) 0-20, (2) 20-40, (3) 40-60, (4) 60-85 cm. Whereas: (A) Mg; (B) Mg-EG, (C) K treatment and (D) K 550 C |
 | |
| Fig. 7: | DTA and TGA curves of clay fraction of profile 1; at depths: (A) 0-20; (B) 20-50; (C) 50-70; (D) 70-105 cm |
 | |
| Fig. 8: | DTA and TGA curves of clay fraction of profile 2; at depths: (A) 0-33, (B) 33-60, (C) 60-75 cm |
 | |
| Fig. 9: | DTA and TGA curves of clay fraction of profile 3; at depths: (A) 0-8, (B) 8-25, (C) 25-50, (D) 50-80 cm |
 | |
| Fig. 10: | DTA and TGA curves of clay fraction of profile 4; (A) 0-15, (B) 15-50, (C) 50-75, (D) 75-105 cm |
 | |
| Fig. 11: | DTA and TGA curves of clay fraction of profile 5; (A) 0-20, (B) 20-40, (C) 40-60, (D) 60-85 cm |
The influence of pH on structural of kaolinites has been reported by Sei et al. (2006). Thus acid media result in ordered and coarse-grained particles. While, alkaline media cause disordered and fine grained kaolinites. Smykatz-Kloss (1974) recognized the following classification to realize the degree of structural order of kaolinite: Extremely disordered kaolinites have (Tendo <530°C), very disordered kaolinites (530°C< Tendo <555°C), less disordered kaolinites (555°C< Tendo <575°C) and well ordered kaolinites (Tendo >575°C). From these suggestions, kaolinite of the clays studied could be described as disordered. The same result was reported by Al-Arifi (1992) in Al-Darb soil which is north our study area. The structural disorder is expected to modify the chemical and physical properties of kaolinite. Moreover, the differential thermal analysis is sensitive to shape of kaolinite particles. Spherical particles have lower dehydroxylation temperatures than hexagonal particles (Huertas et al., 1997). The ideal form for the well crystallized kaolinite particles is hexagonal.
The reaction of dehydroxylation of kaolinite is:
Al2Si2O5(OH)4 (kaolinite) → Al2Si2O7 (metakaolinite)+ 2H2O |
Therefore, the theoretical value of weight loss of dehydroxylation is 13.96%. Eslinger and Peaver (1988) determined the mass loss of an ideal kaolinite to be 14%. This estimation of the percentage of kaolinite was confirmed with DTA (Hewitt and Churchman, 1982). In present study, weight loss associated with dehydroxylation of kaolinite (513-540°C) ranged from 4-6.6% with average 5.4%. These mass losses give the calculated amounts of kaolinite on the bulk studied clay samples to be around 29-47% with average 39%.
The exothermic peak of kaolinite (≈1000°C) did not appear in this study. This could be explained by the presence of even a small amount of iron oxide or hydroxide which are suggested to modify the temperature exotherm. Finally, other endothermic peaks were observed around ≈700°C and 800-900°C. These peaks could be explained by the presence of smectite and illite (Paterson and Swaffield, 1987).
The profiles show a textural differentiation between the soil surface and deeper horizons, but clay minerals are similar. This could be explained, by arid and semi-arid climatic conditions that do not support intense and deep pedogenic processes. Moreover, soil particles could be redistributed by alluvial and aeolian processes. The most important factors controlling the mineralogical and geochemical composition of the clay fraction of the Jazan region are the composition of the bedrock and the possible occurrence of an old weathering. Part of the clay minerals in the soils of Jazan could be suggested to be from long-range aeolian dust transported mainly from arid and semiarid regions such as North Africa. Pye (1987) reported that the major components in continental dusts are quartz, feldspars, calcite, dolomite, micas, kaolinite, illite, smectite, mixed-layer silicates and palygorskite.
CONCLUSION
X-ray diffraction and DTA with DTG indicated that, smectite, chlorite, illite, kaolinite are the major clay minerals in all analyzed soil samples. While, low amount of chlorite was found in some samples. Additionally, quartz and feldspars were detected as accessory minerals. The most important factors controlling the mineralogical and geochemical composition of the clay fraction of the Jazan region are the composition of the bedrock and the possible occurrence of an old weathering. Moreover, part of the clay minerals in the soils of Jazan could be suggested to be from aeolian dust transported mainly from surrounding arid and semiarid regions.
Profile 2 has more smectite compared to other profiles. The dehydroxylation temperatures of kaolinite indicated structural disorder. Moreover, the mass of kaolinite on the clay samples was suggested to be around 29-47% with average 39%. Finally, illite mineral is assumed to be of dioctahedral type.
ACKNOWLEDGMENT
The author wishes to thank Prof. Abdulazeem Salam, Soil Science department, King Saud University, Riyadh, Saudi Arabia, for his assistance and efforts during laboratory work and his suggestions.
REFERENCES
- Goldberg, S. and R.A. Glaubig, 1987. Effect of saturating cation, pH and aluminium and iron oxides on the flocculation of kaolinite and montmorillonite. Clays Clay Minerals, 35: 220-227.
Direct Link - Hart, R.D., R.J. Gilkes, S. Siradz and B. Singh, 2002. The nature of soil kaolins from Indonesia and Western Australia. Clays Clay Minerals, 50: 198-207.
Direct Link - Hart, R.D., W. Wiriyakitnateekul and R.J. Gilkes, 2003. Properties of soil kaolins from Thailand. Clay Minerals, 38: 71-94.
Direct Link - Huertas, F.J., S. Fiore and J. Linares, 1997. Thermal analysis as a tool for determining and defining spherical kaolinite. Clays Clay Minerals, 45: 587-590.
Direct Link - Melo, V.F., B. Singh, C.E. Schaefer, R.F. Novais and M.P. Fontes, 2001. Chemical and mineralogical properties of kaolinite-rich Brazilian soils. SSSAJ., 65: 1324-1333.
Direct Link - Nelson, D.W. and L.E. Sommers, 1996. Total Carbon, organic carbon and organic Matter. In: Methods of Soil Analysis, Part 3: Chemical Methods, Sparks, D.L., American Society of Agronomy/Soil Science Society of America, Madison, WI., USA., ISBN-13: 978-0891188254, pp: 961-1010.
Direct Link - Rhoades, J.D., 1996. Salinity: Electrical Conductivity and Total Dissolved Solids. In: Methods of Soil Analysis, Part 3: Chemical Methods, Sparks, D.L. (Ed.). Soil Science Society of America, Madison, WI., USA., ISBN-13: 9780891188254, pp: 417-435.
Direct Link - Sei, J., F. Morato, G. Kra, S. Staunton, H. Quiquampoix, J.C. Jumasc and J. Olivier-Fourcadec, 2006. Mineralogical, crystallographic and morphological characteristics of natural kaolins from the Ivory Coast (West Africa). J. Afr. Earth Sci., 46: 245-252.
CrossRef - Wakindiki, I.I. and M. Ben-Hur, 2002. Soil mineralogy and texture effects on crust micromorphology, infiltration and erosion. Soil Sci. Soc. Am. J., 66: 897-905.
Direct Link - Singh, B. and R.J. Gilkes, 1992. Properties of soil kaolinites from South-Western Australia. Eur. J. Soil Sci., 43: 645-667.
CrossRefDirect Link
Raad A. Al-Tamimi Reply
I read this article and i am interested in, so I hope that I can have it . with my grateful.