
Rana Muhammad Iqbal
Cholistan Institute of Desert Studies, Islamia University, Bahawalpur, Pakistan
Journal of Applied Sciences
Year: 2003 | Volume: 3 | Issue: 10 | Page No.: 650-658


ABSTRACT
A hydroponic experiment was carried out to see the effects of salinity by using a randomized complete block design with 4 salinity treatments and 5 replicates. The salinity levels tested were 0, 50, 100 and 150 mol m-3 NaCl. CaCl2 was also applied to the salinity treatments. Leaf temperature was significantly increased by salinity during noon and afternoon whereas the results for the morning were inconsistent. Transpiration rate (E) showed no obvious diurnal variation but was significantly decreased by salinity during morning and noon but the trends with salinity levels were inconsistent. Net photosynthesis (Pn) was not significantly affected by salinity during the morning. During noon and afternoon, Pn was significantly higher at 150 mol m-3 NaCl than at 50 mol m-3 NaCl whereas the difference between other treatments was not significant. Pn was lower at 50 mol m-3 NaCl than in other treatments at all sampling times. There were no consistent trends of Pn due to diurnal variation. Stomatal conductance (gs) was higher in the morning than in the noon and afternoon. Sub-stomatal CO2 level (Ci) decreased with salinity and was significantly higher at 0 mol m-3 NaCl than at 100 and 150 mol m-3 NaCl during noon and afternoon but not for 100 mol m-3 NaCl during morning. Variation in light intensity due to clouds during measurements and absence of any equilibration prior to measurements made it difficult to detect whether the effects of salinity on gas exchange varied according to time of day.
PDF Abstract XML References Citation
How to cite this article
Rana Muhammad Iqbal, 2003. Diurnal Variations in Net Photosynthesis and Other Gas Exchange Parameters of Spring Wheat under Saline Conditions. Journal of Applied Sciences, 3: 650-658.
DOI: 10.3923/jas.2003.650.658
URL: https://scialert.net/abstract/?doi=jas.2003.650.658
DOI: 10.3923/jas.2003.650.658
URL: https://scialert.net/abstract/?doi=jas.2003.650.658
INTRODUCTION
Grain yield in wheat is a composite of assimilate produced over the life of the plant. This may be partitioned into two major components: dry mater produced before anthesis and re-mobilized to the grain during grain filling and dry matter produced after anthesis and translocated directly to the grain or stored temporarily in vegetative organs before being remobilized to the grain (Pheloung and Siddique, 1991). Dry matter formed prior to anthesis has been estimated to contribute 3-30% of the grain dry matter at maturity. The effect of salinity on photosynthesis is complex. Elevated but low salinity levels sometimes even enhance photosynthetic performance (Iqbal and Wright, 1991). At medium or high salinity, leaf photosynthesis is inhibited (Shabala et al., 1998). It is believed that, at intermediate salinities, the predominant mechanism is the stomatal limitation of photosynthesis and that the non-stomatal limitation at the biochemical level prevails under more sever salinity (Plaut et al., 1989; Bethke and Drew 1992; Everard et al., 1994). The main cause for the non-stomatal limitation of photosynthesis seems to be an accumulation of the toxic ions in leaf cells ( Huang and Van Steveninck, 1989; Cramer 1992). Hence, the ability to limit this accumulation is an important mechanism of salt tolerance (Shabala et al., 1998).
Because photosynthetic rate shows diurnal variation (English et al., 1979; Iqbal, 1992), it was necessary to measure gas exchange rate (GER) at different times during the day. In previous experiments (Iqbal, 1988; Kemal-ur-Rahim, 1988; Iqbal, 1992)) higher Na+ and Cl- concentrations have been found in later emerging leaves. The effect of salinity on leaf extension rate (LER) increases with leaf position on the mainstem (Iqbal, 2003). Therefore in this experiment, GER was measured in early appearing leaves (leaf 5 and leaf 7).
MATERIALS AND METHODS
Experimental design and treatments
A hydroponic experiment was carried out to see the effects of salinity at University of Wales, Bangor, U.K. The experiment was carried out using a randomized complete block design. There were 4 salinity treatments and 5 replicates. The salinity levels tested were 0, 50, 100 and 150 mol m-3 NaCl. CaCl2 was also applied to the salinity treatments (50, 100 and 150 mol m-3 NaCl) in the ratio of 20:1 (moles Na: moles Ca) as suggest by Gorham et al. (1985) in order to increase the potassium/sodium ratio (Hanson, 1984).
Plant material and growth conditions
The experiment was initiated on 13 May and terminated on 29 June. Spring Wheat variety Wembley was used in this experiment. The experiment was carried out in glasshouse with no control of temperature and without supplementary lighting.
Growth containers and aeration
In previous experiment, there were 16 plants per container. In this experiment many plants were required for chemical analyses, GER measurements and growth analyses. Therefore, large containers were used. In this experiment 25 L water holding plastic containers (63 cm x35 cm wide x 18.5 cm deep) were used. Prior to seeding, eight 7 mm (for air supply) and one 9 mm (for solution changes) holes were made in the front, sides and bottom of the containers. The holes were plugged with rubber bungs to facilitate easy changes of nutrient solutions and to fix air supply needles (No. 16: Terumo Europe, Belgium). The containers were arranged along the sides of large workbenches, again to facilitate easy access for maintenance and measurements. Instead of polyurethane tubing, silicon tubing (Scientific Services, Chester, UK) was used to facilitate sealing of holes created by needles in it. The silicon tubing (5mm internal diameter (ID), 8 mm outer diameter (OD)) was fixed along the sides of the work benches and then connected to the air regulator. Air from the silicon tubing to the containers was supplied via narrow (0.58 mm ID, 0.96 mm OD) polythene capillary tubing (Portex Ltd. Hythe, Kent, England), which was cut into the silicon tubing and the bungs fitted in the containers. This system allowed a more uniform and efficient distribution of air in each container and avoided the air blockage problem encountered when using the 3-way air regulators and aerators in previous experiment (Iqbal, 1988).
Germination and raising of seedlings
Wheat seeds were germinated and grown in P180 Plugtrays (Cookson Plantpak Ltd., Maidon, Essex, UK). Prior to seeding, capillary matting was fixed at the bottom of each plugtray with copydex. Another P180 plugtray was stacked on top with the one containing the capillary matting at the bottom. This provided increased strength to the plugtray to withstand plant weight gained later during the experiment. The pairs of plugtrays were then placed on the top of the 25 L containers, which were filled with nutrient solutions (0.4 g/L Phostrogen). All the cells of the P180 plugtrays were filled with vermiculite. Initially, after soaking the vermiculite, seeds were sown directly into the trays with one seed per cell and a total of 180 seeds per tray. After 4 days it was realized that by using this technique, the nutrient solution was creating waterlogged condition for the germinating seeds, even though they were aerated through the air supply. The experiment was therefore re-sown. New seeds were presoaked over night in a muslin bag suspended under a slow running tap. The next morning the seeds were sown on the moist vermiculate in the P180 plugtrays with one seed per cell and a total of 180 seeds per tray (51.5 cm x 30.0 cm). The seeds then covered with newspapers and kept moist until the radicles and coleoptiles were seen to be emerging. The newspapers were later removed. The containers were then filled with tap water containing 0.4 g/ L Phostrogen and the trays placed over the containers. The seedlings were later thinned to 90 per tray by uprooting alternate rows along the width of the tray, as 9 rows of 10 plants at a distance of 60 x 30 mm, which is equivalent to a plant population of 583 plants m-2.
Preparation of nutrient based salt solution
In this experiment, for ease of preparation and solution changes, Phostrogen based nutrient and salt stock solution were used for each treatment. After necessary calculations for each salt treatment being made, Phostrogen and all the micronutrients were added to each salt stock solution and the volume was made to 10 L and then stored in a cold room for further use. This technique facilitated the maintenance of a uniform supply of salt stress throughout the course of experiment.
Application of salt stress
Prior to salt stress (12 days after seeding), when the plants had 2 emerging leaves, the containers were drained out and refilled. The stock salt and nutrient solutions were drip fed into the plant containers from polyurethane containers, which were fixed to retort stands. One needle, connected to polythene capillary tubing was inserted into the bottom side of the polyurethane container and the other into the 25 L container holding the plants. The concentration of stock solutions varied for each treatment so that final desired concentration would be achieved. By this method salinity was introduced gradually and continuously over a 2 days period in each treatment. Salinisation was completed at 1+2 leaf stage (one fully expanded and two expanding leaves).
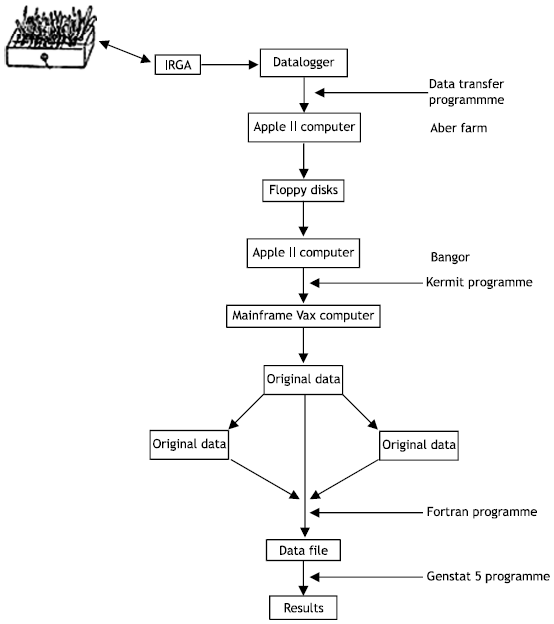 | |
| Fig. 1: | Flow diagram showing main steps followed for recording data on data logger of infra-red gas analyser (IRGA), data logger to mainframe computer and statistical analysis to obtain results for different treatment |
Gas exchange measurements
At least 15 minutes prior to gas exchange (GER) measurements, the air supply unit, infrared gas analyser (IGRA) and the Parkinson leaf chamber (PLC) were switched on to purge the humidity in the system and to bring IRGA and the PLC up to their operating temperature. GER measurements on leaf 5 were made in situ on fully expanded leaves on 14 June. Measurements were made between 08.00-10.00 (morning), 12.00-14.00 (noon) and 16.00-18.00 (afternoon) on randomly selected mainstem leaves at the appropriate insertion in each replicate container and salinity treatment. There were, leaves x 5 replicates x 4 salinity treatments. These measurements were carried out in the glasshouse with no supplementary lighting. The PLC was clamped over the central portion of a leaf and held horizontally, care being taken to keep the adaxial side of the leaf uppermost and to avoid shading by any of the other leaves. To avoid stomatal closure, CO2 depletion and other parameters were recorded approximately 30 seconds leaf enclosure in the PLC. Immediately after GER measurements were made, the leaf lamina was cut from the point joining the sheath and preserved in a polythene bag for leaf area and sap extraction. The plants were marked with paint so that they were not used for further measurements and to maintain the desired plant population. Measurements of leaf 7 at 100 and 150 mol m-3 NaCl salinity treatments were made on 20 June (24 DAS). This time, instead of 2 leaves per replicate container, 10 randomly selected leaves from one replicate were used for GER measurements during morning, noon and afternoon. GER measurements for leaf 7 of all the salinity treatment in each replicate container were also made during the morning on 32 DAS when leaf 7 became fully expanded at 0 and 50 mol m-3 in NaCl. The measurements for noon and afternoon were postponed due to low PAR. In the afternoon the plants were sprayed for mildew next morning, GER measurements at 0 and 50 mol m-3 NaCl were recorded but were not considered suitable for statistical analysis due to spray damage to plants.
Transfer and analysis of data
The data collected by the datalogger were transferred to floppy disks on an apple II microcomputer via an RS232 interface through a transfer programme at Aber Farm, 7 miles from the main University at Bangor. The data was stored in this format and later transferred onto the mainframe computer at Bangor using another Apple computer and transfer programme (Fig. 1). During the GER measurements whenever the humidity inside the glasshouse was high (70%) and gs exceeded 0.999, the data logger was not able to calculate T1, E, gs and Pn but was able to record CO2 depletion, air temperature, relative humidity and photon flux density. This specific problem occurred because the programme inside the data logger would not accept values of gs 1.0 or greater (Parkinson, Personal communication). This problem was overcome later on.
RESULTS AND DISCUSSION
Gas exchange measurements
In all the salinity treatments, leaf 5 reached full expansion almost at the same time, Therefore, the gas exchange measurements of this leaf were made on the same day. However, leaf 7 reached full expansion earlier at 100 and 150 mol m-3 NaCl. In previous studies, such difference was also observed (Iqbal, 1992; 2003). Therefore, the results for leaf 7 consist firstly of those measurements recorded on 20 June when leaf 7 had reached full expansion at 0 and 50 mol m-3 NaCl. Further measurements were made on leaf 7 for the salinity treatments, when leaf reached full expansion at 0 and 50 mol m-3 NaCl. The results for this day are only available for the morning because of low Photosynthetically active radiation (PAR) in the afternoon. In the afternoon the plants were sprayed with Mistral fungicide, which caused damage to the plants.
The experiment was terminated and hence results for 0 and 50 mol m-3 NaCl salinity treatments are not available for noon and afternoon.
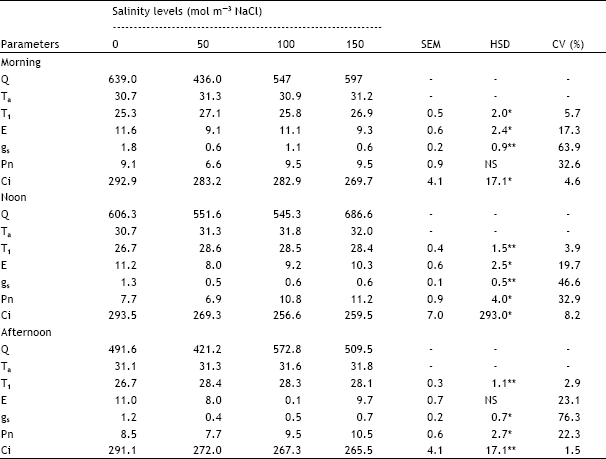
| Table 1: | Effect of different salinity levels on diurnal variation of leaf temperature (T1 in °C), transpiration rate (E in mmol m-2s-1), stomatal conductance (gs in mol m-2s-1), net photosynthesis (Pn in μmol m-2 s-1) and sub-stomatal CO2 concentration (Ci in μL L-1) of fully expanded leaf 5 of spring wheat |
 | |
| Table 2: | Effect of different salinity levels on diurnal variation of leaf temperature (T1 in °C), transpiration rate (E in mmol m-2 s-1), stomatal conductance (gs in mol m-2s-1), net photosynthesis (Pn in μmol m-2 s-1) and sub-stomatal CO2 concentration (Ci in μL L-1) of fully expanded leaf 7 of spring wheat |
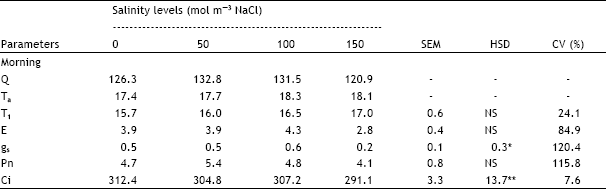 | |
| Q = Light intensity (μmol m-2 s-1), Ta = Air temperature (°C),, -=Data not analysed, SEM = Standard error of means, HSD = Honestly significant differences, CV = Coefficient of variation, NS = Not significant, *, ** = Significant at 5 and1% probability levels, respectively | |
Therefore, the results for leaf 7 when it reached full expansion on 20 June for morning, noon and afternoon at 100 and 150 mol m-3 NaCl are not presented due to lack of comparison with those at 0 and 50 mol m-3 NaCl.
Gas exchange of leaf 5
The coefficient of variation (Table 1) was very high for stomatal conductance (gs: 76%), net photosynthesis (Pn: 32%) and transpiration rate (E: 23%) whereas it was low for leaf temperature (T1: 6%) and sub-stomatal CO2 level (Ci: 8%). Analysis of data with Q (light intensity) as covariate was also performed but it did not improve the analysis.
Diurnal variation in T1 followed changes in air temperature (Ta) but it was 3-5 °C lower than the latter. T1 was significantly increased by salinity during noon and afternoon whereas the results for the morning were inconsistent. Transpiration rate (E) showed no obvious diurnal variation but was significantly decreased by salinity during morning and noon but the trends with salinity level were inconsistent. During afternoon E was not significantly affected but was higher at 0 mol m-3 NaCl than in all other salinity treatments. E was slightly decreased at 50 and 100 mol m-3 NaCl during noon and afternoon but was almost at the same rate at 0 and 150 mol m-3 NaCl. Stomatal conductance (gs) was higher in the morning than in the noon and afternoon. Salinity significantly decreased gs but the trends with salinity level were inconsistent at all sampling times. Net photosynthesis (Pn) was not significantly affected by salinity during the morning. During noon and afternoon Pn was significantly higher at 150 mol m-3 NaCl than at 50 mol m-3 NaCl whereas the difference between other treatments was not significant. Pn was lower at 50 mol m-3 NaCl than in other treatments at all sampling times. There were no consistent trends of Pn due to diurnal variation. Sadras et al. (1993) observed that stomatal conductance is less responsive to water deficits than tissue expansion. Reduction in gas exchange by reduction in stomatal conductance depends on the extent to which vegetation is coupled to its surrounding atmosphere (Sadras and Milroy, 1996). Sub-stomatal CO2 level (Ci) decreased within salinity and was significantly higher at 0 mol m-3 NaCl than at 100 and 150 mol m-3 NaCl during noon and afternoon but not for 100 mol m-3 NaCl during morning. At 0 mol m-3 NaCl. Ci was similar at all three sampling times. In the salt stressed treatments Ci was lower at noon than in the morning and afternoon (Iqbal, 1992).
Gas exchange of leaf 7
The coefficients of variation were extremely high for E (85%), gs (120%) and Pn (116%) for leaf 7 (Table 2) and higher than those recorded for leaf 5. T1, E and Pn were not significantly affected by salinity. T1 increased with increase in salinity level but results for E and Pn were inconsistent. gs was significantly lower at 150 mol m-3 NaCl than at 0, 50 and 100 mol m-3 NaCl but the trend for these treatments was inconsistent. Ci was significantly higher at 0 mol m-3 NaCl than at 150 mol m-3 NaCl but the difference between 0, 50 and 100 mol m-3 NaCl was not significant.
When GER measurements of leaf 5 and leaf 7 were made, Q showed wide variation. For example Q for leaf 5 during noon measurements varied from 221 to 1234 μmol m-2s-1 whereas Tl was more constant. Pn should show diurnal variation reflecting these variations in Q and internal leaf water status (which determines gs). Pn increased in some treatments but the results were inconsistent, therefore, in the present investigation the long-term changes were masked by wide and short-term fluctuations in Q due to movement of clouds. Variation in Q during measurements and absence of any equilibration prior to measurements made it difficult to detect whether the effects of salinity on GER varied according to time of day. During the present study Pn, gs and E varied markedly between plants. Therefore, high coefficient of variation made it difficult to detect significant differences between treatments. Data were also analyzed with Q as covariate. This assumes a linear relationship between the various parameters and Q but the regression was generally not significant. Therefore, use of Q, as covariate did not improve the analysis of variance.
Keeping in mind all the problems, which occurred during GER measurements due to variation in light intensity and absence of any equilibration, it is suggested to use constant light source in a light chamber (Kemal-ur-Rahim, 1988; Iqbal, 1992) or under field conditions in country like Pakistan where sun light conditions do not fluctuate as in UK. Also as ion concentrations were higher in older leaves, therefore, it needs to study changes in ion concentrations and Pn during leaf expansion and senescence (Iqbal and Wright, 1991; Shabala et al., 1998). This is also supported by the fact that stresses experienced by crops during growth have cumulative effects, which are ultimately expressed as a reduction of final biomass below the unstressed potential. The mechanism involve changes in the crop’s ability to gather the energy required to fix CO2 , the capacity to use the energy, or the time available for both. The correlation between the accumulation of biomass in plants and the amount of solar radiation intercepted is well known (Kiniry et al., 1989).
REFERENCES
- Bethke, P.C. and M.C. Drew, 1992. Stomatal and nonstomatal components to inhibition of photosynthesis in leaves of Capsicum annuum during progressive exposure to NaCl salinity. Plant Physiol., 99: 219-226.
Direct Link - Cramer, G.R., 1992. Kinetics of maize leaf elongation II. Responses of a Na-excluding cultivar and a Na-including cultivar to varying Na/Ca salinities. J. Exp. Bot., 43: 857-864.
CrossRefDirect Link - Everard, J.D., R. Gucci, S.C. Kahn, J.A. Flore and W.H. Loescher, 1994. Gas exchange and carbon partitioning in the leaves of celery (Apium graveolens L.) at various levels of root zone salinity. Plant Physiol., 106: 281-292.
Direct Link - Iqbal, R.M., 2003. Leaf extension growth of wheat grown under NaCl and Na2SO4 salinity. Asian J. Plant Sci., 2: 1092-1096.
CrossRefDirect Link - Kiniry, J.R., C.A. Jones, J.C. O`Toole, R. Blanchest, M. Cabelguenne and D.A. Spanel, 1989. Radiation-use efficiency in biomass accumulation prior to grain filling in five grain-crop species. Field Crop Res., 20: 51-64.
CrossRefDirect Link - Pheloung, P.C. and K.H.M. Siddique, 1991. Contribution of stem dry matter to grain yield in wheat cultivars. Aust. J. Plant Physiol., 18: 53-64.
Direct Link - Sadras, V.O. and S.P. Milroy, 1996. Soil-water thresholds for the responses of leaf expansion and gas exchange: A review. Field Crop Res., 47: 253-266.
CrossRef - Shabala, S.N., L. Shabala, A.I. Martynenko, O.K. Babourina and I.A. Newman, 1998. Salinity effect on bioelectric activity, growth, Na+ accumulation and chlorophyll fluorescence of maize leaves: A comparative survey and prospects for screening. Aust. J. Plant Physiol., 25: 609-616.
Direct Link