
A. Vaselali
Department of Physical Oceanography, Tarbiat Modares University, Iran
S.A. Azarmsa
Faculty of Oceanography, Tarbiat Modares University, Iran
Journal of Applied Sciences
Year: 2009 | Volume: 9 | Issue: 19 | Page No.: 3522-3530


ABSTRACT
Sediment transport driven by current, wind and wave plays an important role in influencing the evolution of offshore and onshore bed morphologies by deposition and erosion. Correspondingly, the offshore and onshore industrial devices may be seriously damaged in some extremely cases like typhoons, hurricanes and so on. Therefore, one of the most important issues for coastal engineering is suitable structure layout. Also, the study on sediment transport phenomena under various environmental conditions is an important subject to both coastal engineers and researchers. Fishing port of Pozm located in the Northern part of the Oman Sea involved in sedimentation predicament, so that to difficult correct exploitation of this in practice. A new breakwater was constructed in the West to East direction, perpendicular to a former breakwater, in order to solve a sedimentation problem in the Pozm Fishing Port. In this study, sediment movement has been studied using a numerical model in Pozm Bay. Sediment transport caused longshore currents are simulated, before and after construction of the new breakwater, with MIKE21 non-cohesive sediment transport module (ST). The model was calibrated by use of a combination of field data and calibration parameters derived from existing literature. The model reproduced the hydrodynamics satisfactorily as well as the concentration level and variation of non-cohesive sediment transport. Results of this study anticipate that sediment settlement around the newly constructed breakwater occurs and problems like those investigated near the North-South breakwater may be repeatedly observed for the east-west breakwater, too.
PDF Abstract XML References Citation
How to cite this article
A. Vaselali and S.A. Azarmsa, 2009. Analysis of Breakwater Construction Effects on Sedimentation Pattern. Journal of Applied Sciences, 9: 3522-3530.
DOI: 10.3923/jas.2009.3522.3530
URL: https://scialert.net/abstract/?doi=jas.2009.3522.3530
DOI: 10.3923/jas.2009.3522.3530
URL: https://scialert.net/abstract/?doi=jas.2009.3522.3530
INTRODUCTION
Interactions between waves, current and sediment transport are very complicated in the coastal and estuarine waters. Understanding these interactions has been of interests to coastal oceanography and engineering; e.g., coastal protection, land reclamation, dredging of deep water navigational channels, water quality management and ports sedimentation problems (Zhao et al., 2006). Both coastal oceanographers and coastal engineers would like to understand the fundamental physical processes governing the sediment transport in the coastal and estuarine waters (Whitehouse et al., 2000; Winterwerp et al., 2004). In coastal environments, sediments are continuously being eroded, transported and deposited. This leads to an ongoing evolution of the bed at all spatial and temporal scales. The investigation and understanding of the governing dynamic processes is crucial for the prediction of future coastal evolution (Winter, 2007). Due to the complexity of sediment dynamics, experimental researches are necessary; beside, surveying sediment transport in the field is a formidable challenge since the nonuniform and non-stationary processes require costly measurements at high spatial and temporal resolution. But with the progress in computation technique, the numerical simulation becomes another highly efficient measure. Based on research carried out since the middle of the 20th century, numerical hydrodynamic and sediment transport models have been developed in the recent decades (Mehta et al., 1989; Teisson, 1991; Mulder and Udink, 1991; Toorman, 2001). A large variety of numerical modeling systems following different physical and numerical approaches and methods have been developed in the past decades (Davies et al., 1997). More details about the sediment transport can be described by simulation, and a long-term prediction can be made at a lower cost (Zhang and Liu, 2007).
Process-based coastal area models numerically solve mathematical equations describing the relevant hydrodynamic and transport processes. The simulations are performed on a computational grid covering the area of interest. Driven by specified conditions at the open modelboundaries (e.g., wind on the surface, water levels, and sediment concentrations at the lateral boundaries), the advective and diffusive processes throughout the model domain are simulated. The hydro- nd sediment dynamics are either computed successively in coupled computational modules (Nicholson et al., 1997), or processed simultaneously in integrated modelling systems (Lesser et al., 2004). In this study, sediment movement has been studied using a numerical model in Pozm Bay.
In this study, a numerical non-cohesive sediment transport model has been used to determine the amount of sediment that is transported through the main area of the Pozm Bay in Northern of Oman Sea. Furthermore, the fundamentals of the model and the calibration of the sand sediment transport module have been described. A net sediment discharge through three profiles around the breakwaters of Bay, besides, is computed and a discussion of the sediment budget of the Pozm Bay compartment is provided. Therefore this research discuss the East-West direction breakwater construction effects on sedimentation pattern and rate of sedimentation process arising from longshore currents by applying ST module of numerical MIKE21 model.
STUDY AREA
Pozm Bay is situated between latitudes 25°21’ to 25°24’ North and longitudes 60°10’ to 60°19’ East in the Southeastern Iranian in Northern of Oman Sea.This Bay is one of the omega shape bays that forms coastal strip of Southeastern Iran. Figure 1 shows the satellite images of the geographical location of Pozm Bay.Pozm fishing port is located at the fringe of Southeastern Pozm Bay. Bay. With the beginning of operation of the port, problem of arduous sediments in the behind of breakwater caused appearance of problems in the operation of this port (Fig. 2a).
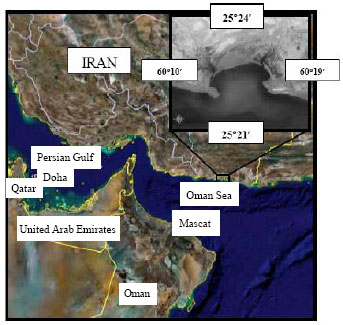 | |
| Fig. 1: | Geographical location of Pozm Bay |
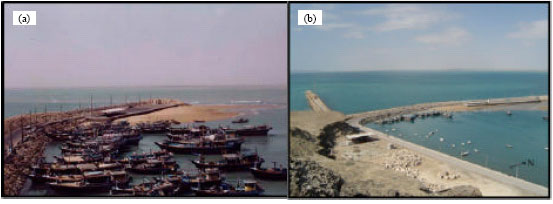 | |
| Fig. 2: | (a) Sedimentation problem in the behind of South- North direction breakwater, (b) Two breakwaters layout of Pozm Bay |
It is worth to mention that a dredging took place in the early 1995 in the region to solve this complication. However, the problem of sedimentation remained with force and therefore more studies about this problem carried out in 1996. After a thorough studies, numerous choices have presented that utmost, with due attention to the conditions, executed a vertical breakwater construction on the previous breakwater in the east-west direction at the length of 500 m. Figure 2b shows the Layout of Pozm Bay‘s breakwaters.
MODEL DESCRIPTION
The Marine Software Products of MIKE introduced by the Danish Hydraulic Institute (DHI) is one of the most well known, user-friendly and professional tools for the study of many aspects of marine hydrodynamics and environment. The modeling tools available in MIKE facilitate easy applications at any stage of projects-from feasibility through design, construction to operation and maintenance. The package of MIKE nowadays preferred and accepted by many organizations worldwide for study of marine, estuarine and inland surface water ecosystems, along coastlines as well as in harsh wave climates offshore, offshore structures, ports, power and desalination plants. MIKE21 is a comprehensive modeling system for the simulation of hydraulics and hydraulic-related phenomena in estuaries, coastal water and seas. It can be applied to any two-dimensional free-surface flow where stratification can be neglected. The ario us odules of he stem mulate ydrodynamics, vection-dispersion, short waves, sediment transport, water quality, eutrophication and heavy metals. The system has a wide range of engineering and environmental application in coastal hydraulics, oceanography, wave dynamics, harbours, rivers, environmental hydraulics, and sediment processes. An extensive pre- and post-processing module allows analysis and graphical presentation of both data and model results, which are stored in a simple data base. This software has been extensively used in the simulation of hydrodynamics, water quality, wave dynamics and all related processes in estuaries, bays and coastal areas (Chubarenko and Tchepikova, 2001).
Sediment transport and water flow interact with each other. This kind of interaction is coupled through the evolution of bed morphology. Hence most of the available numerical models on sediment transport at present mainly include two modules: the hydrodynamics module (HD) and sediment advection and diffusion module (ST), (Sumer and Fredsxe, 2002). The usual procedure in one time step during simulation is as follows: HD generates the flow information first, the second is to use ST input with the latest flow information from HD to calculate the concentration distribution and further evaluate the bed level evolution by means of the bed morphology equation and the seabed profile is updated with the new bed level at the end of one time step marching.
The results described in this study by using the MIKE 21 modelling system. The system consists of several modules of which three were used here. The hydrodynamic module (MIKE 21 HD) is the basic module that calculates the depth-averaged hydrodynamic conditions in the area (Hogedal, 1998; Rasmussen et al., 1999). Basic output from the model is water fluxes between grid points from which depth averaged current velocities and directions can be derived. Radiation stress changes caused waves breaking were calculated using the Near-shore Spectral Waves module (MIKE 21 NSW) in order to generate of longshore currents by HD module. It is a stationary, parameterized spectral wind-wave model that calculates the dynamics of short-period waves in near-shore areas such as, e.g., estuaries (Johnson, 1998). Output from the model is wave height, wave direction, wave period and Radiation stress for all grid points in the area. For operational use, several wave fields were calculated using three different wave directions and eight different wave height in each direction. This resulted in 24 stationary wave fields each having unique characteristics concerning the hydrodynamic conditions. During the dynamic modelling, an interpolation between these wave-fields was carried out so that time-specific wave-fields were used for each time-step.
Types of sediments in the area study possess much importance particularly from the point of view of their behavior and manner in the mathematical model, and as such, it is one of the important factors in determining sedimentation and erosion patterns, alongside the natural currents in the region. Laboratory analysis on the acquired samples in the ground measurement shows that size of most samples is in fine sand particles size. As whole, an average diameter of sediment in area contains 130 to 150 μm that are non-cohesive sediment portion.
The Sand Transport module (MIKE 21 ST) is the non-cohesive sediment transport module that calculates the rates of non-cohesive sediment (sand) transport for both pure current and combined wave and current situations. In this study, Sediment transport caused longshore currents are simulated, before and after construction of the new breakwater, with MIKE21 non-cohesive sediment transport module (ST).
MIKE21 hydrodynamic module (HD): The hydrodynamic model component of MIKE21 is a general numerical modelling system for the simulation of water levels and flows in estuaries, bays and coastal areas (Warren and Bach, 1992). It simulates unsteady two dimensional flows in one layer (vertically homogeneous) fluids in response to a variety of forcing functions. The water levels and flows are resolved on a square or rectangular grid covering the area of interest. The main inputs to the model are bathymetry, bed resistance coefficients, wind fields, radiation stress files for calculation of longshore currents and water level and/or flux boundary conditions. The model allows flooding and drying over the computational grid during the simulation. MIKE21 HD solves the vertically integrated equations of continuity and momentum in two horizontal dimensions. The equations are solved by implicit finite difference techniques with the variables defined on a spatially staggered grid.
MIKE21 HD makes use of an Alternating Direction Implicit (ADI) technique to integrate the equations for mass and momentum conservation in the space-time domain. The equation matrices that result for each direction and each individual grid line are resolved by a Double Sweep (DS) algorithm.
We have used the two-dimensional hydrodynamic model MIKE21-HD, which is standard software for advanced numerical modelling of hydrodynamics, waves, sediment transport and ecological modeling.
MIKE21 non-cohesive sediment transport odule (ST): MIKE 21 ST is a module in the MIKE 21 application suite for calculating non-cohesive sediment (sand) transport rates. With this module we can calculate sand transport based on pure current information, or we can take waves into consideration too. In addition to sand transport rates, a simulation will give you the initial rates of bed level changes. This is sufficient to identify potential areas of erosion or deposition, but can not take the place of a full morphological model.
MIKE 21 ST can simulate sand transport rates in a wide array of settings, including natural environments like tidal inlets, estuaries and coast lines, and man made constructions like harbours and bridges. Tide, wind, wave and current can all be taken into consideration for optimum precision in the simulations.
MIKE21 nearshore spectral wind-wave module (NSW): MIKE21 NSW is a spectral wind-wave model, which describes the propagation, growth and decay of short period waves in nearshore areas. The model includes the effects of refraction and shoaling due to varying depth, wave generation due to wind and energy dissipation due to bottom friction and wave breaking. The effects of current on these phenomena are included. MIKE21 NSW is a stationary, directionally decoupled, parametric model.
To include the effects of current, the basic equations in the model are derived from the conservation equation for the spectral wave action density. A parameterisation of the conservation equation in the frequency domain is performed introducing the zeroth and the first moment of the wave-action spectrum as dependent variables. The basic equations in MIKE21 NSW are derived from the conservation equation for the spectral wave action density based on the approach proposed by Holthuijsen et al. (1989). The various wind formulations in MIKE21 NSW are discussed and compared in Johnson (1998).
MODEL SETUP
Initially, gathering and determining data of entrance module are essential for designing a model. One of the most important things in a hydrodynamic model setup is to obtain a bathymetry of high accuracy (Table 1). In this study a measuring campaign carried out by the soil conservation and watershed management research center and Iran fisheries organization in 2001 and 2003 was used.
| Table 1: | Relevant hydrodynamic model and sediment transport model parameters used in models simulations |
 | |
In order to obtain a stable model with reasonable computing hours a grid size of 35x200 m and a computing time-step of 5 see were chosen. Relative bed level height and non-cohesive sediment discharge in all computation points were stored with a time interval of 30 min.
Input data of ST module consist of the characteristics of currents in the area, containing depth and current discharge in x and y directions (output of HD module), characteristics of waves in the area, containing wave height, wave period, and direction of wave dispersion (output of NSW model), characteristics of sediment consisting average size particles of d50, their standard deviation, relative density and porosity of sedimentary materials, determining the simulation period for which six hours were considered and calibration parameters of water temperature and bed resistance coefficient. In this study, d50, relative density and porosity equivalent to 0.14, 2.6 and 0.4 mm has been considered, respectively.
Due to low speed of the tidal currents in the Pozm Bay (maximum speed of about 0.024 cm sec-1), rate of sedimentation arising from these currents are negligible and only rate of sedimentation process arising from longshore currents was calculated.
After preparing input data, model was executed in order to determine rate of erosion and deposition in the area. It is worth mentioning that with the use of superposition principle, the results obtained from each model arising from different wave conditions, have been multiplied in their average percentage occurrence and obtained the final result by sum of them in each direction.
MODEL CALIBRATION
The evaluation of model performance aims to express the goodness of fit between field data and model results by simple and objective measures. The hydrodynamic model was calibrated against measured water levels from Pozm Bay using the measurements carried out by the soil conservation and watershed management research center.
Subsequently, the hydrodynamic model was calibrated by means of the bed resistance. A Manning number 32 m1/3sec-1 was applied to the entire study area making the measured and the modelled water levels in good accordance throughout the simulation period.
The non-cohesive sediment transport component of the model is generic and therefore requires several calibration factors to obtain a good description of erosion, transport, settling and deposition of the sediment. Calibration parameters in the ST model are water temperature equivalent to 25°C in the model and bed resistance coefficient that has introduced as Chezy or Manning numbers. In Pozm modeling, a Manning number equivalent to 32 has been used.
RESULT AND DISCUSSION
Results obtained from ST module prior to breakwater construction: Results indicate marine sediment transfer through longshore currents to the bay, adjacent to Eastern and Western opening of Pozm Bay. Transferred sediments inside the bay from its eastern side are log jammed at the back of South-North direction breakwater and they can penetrate to the rear breakwater and inside the fishing Pozm port, with the help of the currents arising from diffraction waves. Likewise, erosion takes place at the mouth of the bay, due to longshore currents. Sediments entering from western bay can also lead to transgression of coastal line towards the sea. More intense sedimentation under the effect of southern currents is at two other directions (South Eastern and South Western). South Western currents have less influence in the transfer of sediments. Eastern and transfer of sediments to the bay, however, they play Western l ongshore currents have no effects in the important role in the transfer of sediments towards mouth. Particularly, Eastern currents play important role in the erosion of Eastern rim of the Pozm Bay (Fig. 3).
Results acquired from ST module after breakwater construction: With the construction of Eastern-Western breakwater, sedimentation patterns bring no changes in the whole bay, whereas the same breakwater construction create much changes in the sedimentation and erosion patterns in the fishing Pozm port area and its adjoining breakwater.
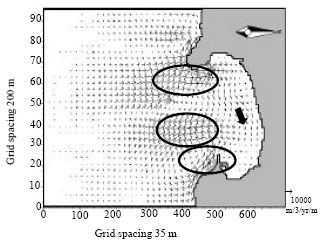 | |
| Fig. 3: | Sediment transfer to the Pozm Bay caused of South, South Eastern and South Western longshore currents |
For this reason, three profiles have been taken into perpendicular on the coast, each with 1000 m lengths. Locations of these profiles have been indicated in (Fig. 4).
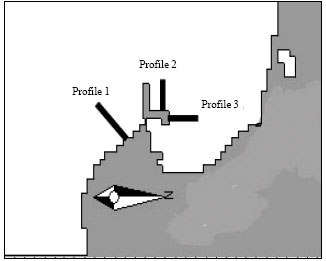 | |
| Fig. 4: | Location of suppositional profiles |
For each of these profiles, the graphs of spatial changes of sediment transfer discharge in the intentional directions with x and y and rate of depth resulting from longshore currents before and after the East-West direction breakwater construction have been obtained.
In profile1, that you can see its related graphs in Fig. 5a-d, at the initial stage of this profile (adjacent to coast) the rate of sediment transfer in the positive direction of x axis has decreased, and breakwater construction has no effect on the rate of sedimentation at the space ahead. Similarly, the rate of sediments transport has also not exposed to towards y axis. Analogical results are also noticeable in the graphs related to longshore currents in all direction. As it was anticipated before, the most of the effects of breakwater construction on the rate of sediment transport in the direction of y is related to southwest longshore currents. The interesting and important point is about (Fig. 5a) (on the right hand side) that breakwater construction has caused erosion deduction at the initial stage of profile. Here dz/dt<0 indicates erosion while dz/dt>0 indicate deposition in the area.
 | |
| Fig. 5: | Sediment discharge and rate of depth caused of longshore currents in (a) South, South Eastern and South Western directions together (b) South direction, (c) South Eastern direction and (d) South Western direction in profile 1 |
As can be observed, curve dz/dt has become close to zero with the breakwater construction that indicate decrease in erosion process.Rate of sediment transport towards north in this profile was 188928.47 (m2 year-1) prior to breakwater constructions that gradually increased to 293237.92 (m2 year-1) with its construction. The reason of this subject is increasing of current velocity in this zone due to breakwater construction. Similarly, total rate of sediment transport found as 192528.52 (m2 year-1) that increased to the amount of 263237.92 (m2 year-1) with the breakwater construction. It is worth to mention that all of the rates of sediment transport the above-mentioned, in reality, is the sediment transport potential whose they can be changed in the nature due to changing condition governing on area and the non-emergence of waves.
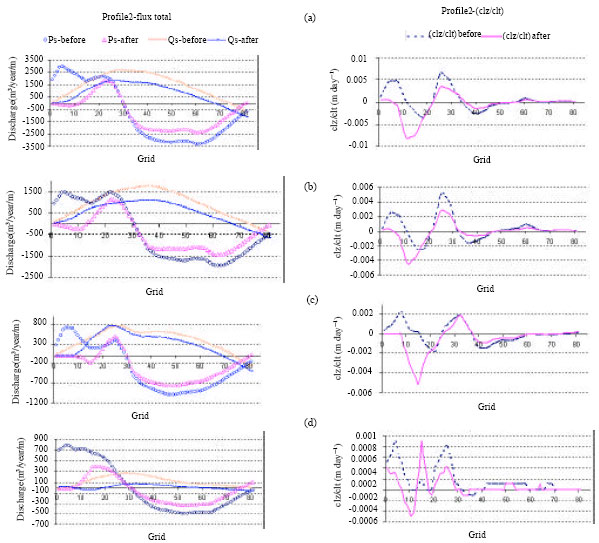
In the profile 2 that has been highlighted with its graphs in the (Fig. 6) breakwater construction have caused the lowering down the rate of sediment transport to the direction of x and y. Conditions in graphs resembling each of the longshore currents in different direction are also of the same. Beginning of the Profile 2, adjacent to coast, more erosion has taken place and has been reduced at the space ahead from the deposition, with the construction of Eastern-Western breakwater (Fig. 6a-d) (right hand side graph). Similarly, Fig. 6c shows the effect of breakwater construction on the curve dz/dt related to South-East current. In this graph, before the construction of breakwater deposition occurs in the initial stage of profile while deposition is stopped after its construction. At the space ahead of this profile, erosion that had continued before the construction became intensive with the construction of breakwater.
In this profile, rate of sediment transport decreases from 134383.08 to 91306.78 (m2year-1), after the breakwater construction.
In the Profile 3 that can be observed in the (Fig.7a-d) the rate of sediment transport in the direction of x and y has exposed to changes with the breakwater construction.
| |
| Fig. 6: | Sediment discharge and rate of depth caused of longshore currents in (a) South, South Eastern and South Western directions together (b) South direction, (c) South Eastern direction and (d) South Western direction in profile 2 |
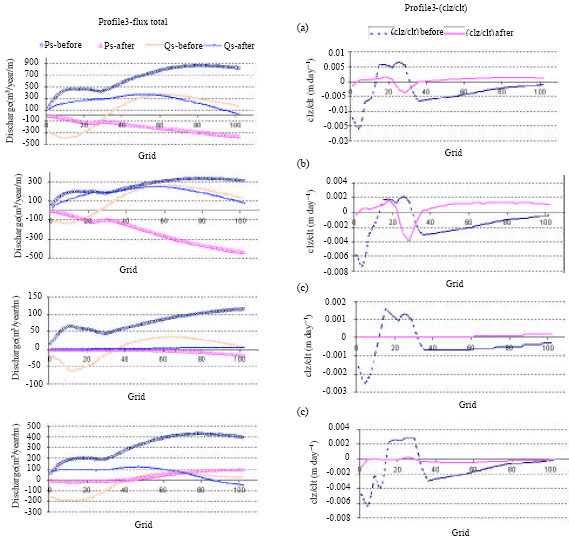 | |
| Fig. 7: | Sediment discharge and rate of depth caused of longshore currents in (a) South, South Eastern and South Western directions together (b) South direction, (c) South Eastern direction and (d) South Western direction in profile 3 |
The graphs indicate that the emergence of erosion and deposition that took place before the breakwater construction in this zone has decreased enormously.
CONCLUSION
Using a numerical hydrodynamic non-cohesive sediment transport model a yearly net import of sediment from the Oman Sea to the Pozm Bay, before and after the West-East direction breakwater construction was established. The model computations suggest an import of 177000 t of sand sediment through longshore currents to the fishing port of Pozm Bay prior to breakwater constructions in the west-east direction that decreased to 85000 t with its construction during year 2005. Also, prior to the breakwater construction in the east-west direction import of 358000 t of sand sediment b ehind the south-north direction breakwater, while after its construction sediment transport to this region decrease to 243000 t. This means that construction of this breakwater have caused decrease in sediment transport into the fishing port while it is possible that sediments settlement around the newly constructed breakwater occurs and problems like those investigated behind the North-South breakwater repeatedly observed for the East-West breakwater during 3.3 years later. The modeled results compare well with other studies despite the fact that the model is generic. The good agreement was obtained by calibrating the model carefully using site-specific field data.
Future tasks must emphasize on setting up non-cohesive sediment transport models on time-scales longer than one year. Modelling on timescales from years to decades can be accomplished by still more powerful computing systems. Modelling the effects of a possible climate change induced sea-level rise on the sediment dynamics in estuaries will also be among the possibilities for modelling tools in the future.
ACKNOWLEDGMENTS
The authors would like to thank Ali karamiye khaniki for supplying field data for model calibration and for fruitful discussions. The authors are thanked for supplying topography measurements from Iran fisheries organization and Mr. Kargar too. This work was partly financed by the Tarbiat Modares University.
REFERENCES
- Chubarenko, I.P. and I. Tchepikova, 2001. Modelling of man-made contribution to salinity increase into the Vistula Lagoon (Baltic Sea). J. Ecol. Model., 138: 87-100.
CrossRefDirect Link - Davies, A.G., J.S. Ribberink, A. Temperville and J.A. Zyserman, 1997. Comparisons between sediment transport models and observations made in wave and current flows above plane beds. J. Coastal Eng., 31: 163-198.
CrossRefDirect Link - Hogedal, M., 1998. Oueme bridge, hydraulic study: flooding risk and stability assessment using MIKE 21. Proceedings of the 7th International Conference on Hydraulic Engineering Software, September 1998, Italy, pp: 437-446.
Direct Link - Holthuijsen, L.H., N. Booij and T.H.C. Herbers, 1989. A prediction model for stationary, short-crested waves in shallow water with ambient current. J. Coastal Eng., 13: 23-54.
CrossRefDirect Link - Johnson, H.K., 1998. On modelling wind-waves in shallow and fetch limited areas using the method of Holthuijsen, Booij and Herbes. J. Coastal Res., 14: 917-932.
Direct Link - Lesser, G.R., J.A. Roelvink, J.A.T.M. van Kester and G.S. Stelling, 2004. Development and validation of a three-dimensional morphological model. J. Coastal Eng., 51: 883-915.
CrossRefDirect Link - Mehta, A.J., E.J. Hayter, W.R. Parker, R.B. Krone and A.M. Teeter, 1989. Cohesive sediment transport: I. Process description. J. Hydraul. Eng. ASCE., 115: 1076-1093.
Direct Link - Mulder, H.P.J. and C. Udink, 1991. Modelling of cohesive sediment transport. A case study: The Western Scheldt estuary. Proceedings of the 22nd International Conference on Coastal Engineering, 1991, American Society of Civil Engineers, New York, pp: 3012-3023.
Direct Link - Nicholson, J., I. Broker, J.A. Roelvink, D. Price, J.M. Tanguy and L. Moreno, 1997. Intercomparison of coastal area morphodynamic models. J. Coastal Eng., 31: 97-123.
CrossRefDirect Link - Rasmussen, E., J. Pietrzak and R. Brandt, 1999. A coupled ice-ocean model for the Greenland, Iceland and Norwegian seas. Deep-Sea Res. Part 2 Top. Stud. Oceanogr., 46: 1169-1198.
CrossRefDirect Link - Sumer, B.M. and J. Fredsxe, 2002. The Mechanics of Scour in the Marine Environment. Advanced Series on Ocean Engineering, Volume 17, World Scientific Publishing Co., USA., ISBN-13: 9789810249304.
Direct Link - Teisson, C., 1991. Cohesive suspended sediment transport: feasibility and limitations of numerical modelling. J. Hydraul. Res., 29: 755-769.
CrossRefDirect Link - Warren, I.R. and H.K. Bach, 1992. MIKE21: A modelling system for estuaries, coastal waters and seas. J. Environ. Software, 7: 229-240.
Direct Link - Winter, C., 2007. On the evaluation of sediment transport models in tidal environments. Sedimentary Geol., 202: 562-571.
CrossRefDirect Link - Winterwerp, J.C., van Kesteren and G.M. Walther, 2004. Introduction to the Physics of Cohesive Sediment in the Marine Environment. Elsevier, New York, ISBN: 978-0-444-51553-7.
Direct Link - Zhao, Z. D., J.J. Lian and J.Z. Shi, 2006. Interaction among waves, current and mud: Numerical and laboratory studies. Adv. Water Resourc., 29: 1731-1744.
CrossRefDirect Link - Zhang, J.X. and H. Liu, 2007. A vertical 2-D numerical simulation of suspended sediment transport. J. Hydrodynamics, 19: 217-224.
CrossRefDirect Link