
Usama A. Ameer
Department of Civil Engineering, College of Engineering, University of Mosul, Mousl, Iraq
Journal of Applied Sciences
Year: 2013 | Volume: 13 | Issue: 5 | Page No.: 663-672


ABSTRACT
Using Fiber Reinforced Polymer (FRP) in rehabilitation of concrete have been increased in the last decades. In the present study, a total of twelve steel-concrete composite beam specimens separated into four groups using normal and high strength concrete, with and without fiber concrete were tested to failure using monotonic load. The test results show that the ultimate resistance increased by increasing compressive strength and/or adding steel fiber to concrete deck comparing with the normal concrete without steel fiber of about 1.4 to 27.1%, also using higher reinforced concrete with steel fiber would decrease deflection of about 9.3 to 29.5% and decrease slip of about 18.8 to 89.1%. A FRP strip, placed in longitudinal and transverse directions and injecting using Epoxy resin are used in treating the tested specimens. The specimens are then retested and the resulting ultimate resistance, deflection and slip are compared with the original test results to investigate the efficiency of each treatment method. Treating using longitudinal FRP was given an ultimate resistance of about 93.8 to 100.5% of original test results, but using transverse FRP give ultimate resistance of about 84.4 to 95.5% of original test results, meanwhile using Epoxy resin give ultimate resistance of about 68.5 to 95.1% of original test results. It was shown that, treating gives lesser deflection and slip compared with the original results.
PDF Abstract XML References Citation
Received: January 17, 2013;
Accepted: April 20, 2013;
Published: June 28, 2013
How to cite this article
Usama A. Ameer, 2013. Rehabilitation of Steel-concrete Composite Beams Using FRP. Journal of Applied Sciences, 13: 663-672.
DOI: 10.3923/jas.2013.663.672
URL: https://scialert.net/abstract/?doi=jas.2013.663.672
DOI: 10.3923/jas.2013.663.672
URL: https://scialert.net/abstract/?doi=jas.2013.663.672
INTRODUCTION
Recently, research works and utilization of fiber reinforced polymer FRP in retrofitting of concrete have increased tremendously. It was shown that FRP material is an effective method for strengthening of deficient reinforced concrete members also it improves their performance. Several researches were conducted to study the behavior of reinforced concrete beam strengthened by FRP and the possible mode of failure.
Jinlong (2005) submitted an experimental and analytical investigation on the behavior of FRP used to strengthening reinforced concrete beams. He concluded that the externally bonding FRP plates to the tension zone of reinforced concrete beams has been accepted as an efficient and effective technique for flexural strengthening (Jinlong, 2005).
Arifovic and Taljsten (2008), investigated the mode of failure of the reinforced concrete beams strengthened with FRP at the bottom face subjected to bending, they concluded that the crack failure predicted due to lower bound load and FRP should be extended along the critical crack region (Arifovic and Taljsten, 2008).
Rahai et al. (2008), strengthened ten reinforced concrete beams specimens by external CFRP strips glued at the bottom of beams using different resins. The performance of these beams is then compared with the non-damaged beams primarily strengthened to investigate the effectiveness of CFRP. It was concluded that there is no difference between using CFRP with epoxy resin and using CFRP with polyester resin in concrete beams (Rahai et al., 2008).
Feilicetti and Domenico (2008) investigated the use of epoxy resin in cracked concrete repair. The study conducted by using low-viscosity slow-setting epoxy-resin injected in cracks initiated in 16 plain concrete beams and tested in bending. It was shown that the treated specimens cracked in different place at a higher failure load (Feilicetti and Domenico, 2008).
High Strength Concrete (HSC) is supposed to enhance the tensile strength of concrete which give better performance comparing with the normal concrete. The experimental researches show that the cracks in HSC members are initiated at final stages of failure compared with normal concrete (Zain et al., 2002).
Kang et al. (2010), investigated the effect of adding fibers to reinforced concrete beam with HSC. The fiber volume ratio varied from 0 to 5% was investigated by conducting bending tests and found that the flexural tensile strength increased linearly with increasing the fiber volume ratio (Kang et al., 2010).
The main objective of the present study is to investigate the effect of using two method of placing FRP strips and epoxy resin as an alternative rehabilitation methods used for steel-concrete composite beams having normal compressive strength reinforced concrete deck and high compressive strength reinforced concrete deck and their effect on flexural resistance, mid-span deflection and slip at ends of steel-concrete composite beam.
MATERIALS PREPARATION AND EXPERIMENTAL TESTING METHODS
High performance concrete can be produced simply by using different mixing proportions as a rational and simple procedure. Moreover, water reducing additives, such as Flocrete, can be used to increase the concrete strength.
Locally available cement manufactured by Mass factory, in Sulaymania City, Iraq is used with 20 mm maximum size aggregates from a location called Kanhash, lies at about 60 km to the south of Mosul City is used. The cement, aggregate and water used in concrete are tested and prepared before construction of composite beam samples. Physical and chemical tests are conducted to ensure that the cement complies with the requirements of Iraqi standards, (Iraqi Specifications IQS No. 5, 1984) The chemical and physical tests results of cement are shown in Table 1.
Local river sand is used as a fine aggregate in concrete, after applying a sieve analysis and it was found to be complying with the British Standards-882 (B.S.882), with clay percentage 1.0% as shown in Table 2. Local river gravel with maximum aggregate size of 20 mm, according to B.S.882 (BS 882, 1992), having a sieve analysis as shown in Table 2 is used as a coarse aggregate in concrete. Physical properties of coarse and fine aggregate are shown in Table 3. A normal drinking (tap water) is used for mixing of concrete.
In order to get the required compressive strength of concrete several mixes are prepared. The final mix proportions (cement: sand: gravel/water) used with a slump of (90 mm) for each type of used concrete, as shown in Table 4. A Flocrete, of 1% of cement weight in each mix, is added to the high strength concrete mixes.
The NNF group denotes the concrete with normal compressive strength, having an average cube compressive strength fcu = 25.8 MPa, without adding steel fiber and NFC group denotes the concrete with normal compressive strength, having average compressive strength fcu = 25.5 MPa, with steel fibers having aspect ratio of 66 added to concrete. Two more groups were designed as a high compressive strength concrete, having average compressive strength fcu = 56.8 MPa, for HNF group cast without adding steel fibers to concrete and having average compressive strength fcu = 57.1 MPa HFC groups cast with steel fibers added to concrete. The last two groups represent a high strength concrete as stated by the ACI - Code, 2011 (ACI, 2011; Aitcin and Mehta, 1990).
In order to investigate the effect of fiber on compressive strength, a total of nine standard concrete cubes, 150x150x150 mm, divided into three groups with three fiber percentages 1.0, 1.5 and 2.0% are prepared and tested according to standard method specified by ASTM specification (ASTM, 2003).
| Table 1: | Physicochemical tests results of ordinary Portland cement |
 | |
| Table 2: | Gradation of aggregate |
 | |
The fibers, shown in Fig. 1a, were placed in a 10 mm sieve put and added gradually (spread) to concrete while mixing the concrete. The test results show that, the optimum fiber percentage of 1.5% is chosen to be used.
The average concrete compressive strength is calculated by testing three standard concrete cubes, 150x150x150 mm, (for each group) according to the method specified by ASTM (2003). The results are listed in Table 5 with their standard deviation. The average results converted to standard cylinder compressive strength (f’c), by considering the standard cylinder compressive strength equivalent to 80% of the standard cube compressive strength.
The composite beams having a total length of 2000 mm is composed of standard hot rolled steel shape (W6X12), (AISC, 1994) connected to 150 mm thickness concrete slab with 550 mm width, as shown in Fig. 1b.
An average steel yield strength (fy = 355 MPa) and ultimate strength of (fu = 487 MPa) obtained from uniaxial tensile test of six strips taken from flange and web of the steel section. The same test is carried out for the 10 mm diameter reinforcement bars giving a yield strength (fy = 494MPa) and ultimate strength of (fu. = 664 MPa). The results of steel section, reinforcement and concrete strength are shown in Table 5. Using, uniaxial tensile test results, the modulus of elasticity is found to be Es = 198650 MPa and Er = 198550 MPa for steel section and steel reinforcement, respectively. A total of 15 steel headed stud mechanical shear connectors (12 mm diameter and 70 mm height, spaced at 125 mm) are used for each sample to connect the steel section to the concrete deck. An average yield strength and ultimate strengths of the connectors also obtained from uniaxial tensile test, which show an average yield strength (fy = 512 MPa) and ultimate strength of (fu. = 685MPa) an average of three samples. The modulus of elasticity of stud connector, was found to be Est = 202200 MPa.
A total of twelve composite beams are constructed and tested at the civil engineering laboratory, Mosul University, the samples are divided into four groups, each of three beams. The headed stud shear connectors are welded to the flange of each steel beam by qualified welders. The connectors spaced at 125 mm C/C, as shown in Fig. 1c and d. A minimum reinforcement area is used as a mesh with 10 mm bar diameter placed at the bottom of concrete flange in both longitudinal and transverse directions. The concrete flange is casted in wooden forms shown in Fig. 1c and d. After concrete casting the concrete surfaces of the beams kept moist with wet burlap for 3 days, then the wooden forms are removed and the specimens cured in air-dry conditions. The composite beam specimens are simply supported at its ends, with a span of 1900 mm between supports. A 500 kN hydraulic jack is used to apply a two point monotonic load applied at top of concrete flange by using a distribution beam and two cross shafts, generating the loading setup shown in Fig. 2. This test setup generates two shear zones near the ends and pure bending zone at the middle of the simply supported beam. The gradually applied loads are monitored and recorded using a load cell. The slip at ends of each beam was recorded at the end of each test and the deflections at mid-span are recorded using transducer with an accuracy of 0.001 mm.
| Table 3: | Physical properties of aggregate |
 | |
| Table 4: | Groups notations and mixes ratios |
 | |
| Table 5: | Concrete cube compressive strength for groups NNF, NFC, HNF and HFC, yield strength of steel section and yield strength of reinforcement with standard deviations |
 | |
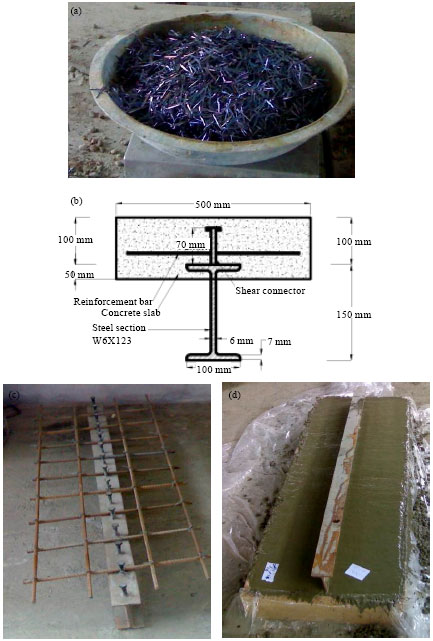 | |
| Fig. 1(a-d): | Steel parts, steel fiber, wood form and concrete casting of beam, (a) Steel fiber, (b) Geometry of composite beam, (c) Section, studs and reinforcement and (d) Concrete casting |
The present study used different compressive strength of concrete with or without steel fibers added to concrete flange of the composite beam specimens in the four groups. These specimens were tested to failure (referred to as original specimens) and then the concrete flange of the same beams treated after failure and retested using the same setup of the original test (referred to as rehabilitated specimens).
Three different methods of concrete deck treatment were used, depending on the mode of failure observed after the original test. Each treatment method is referred to depending on materials used and placing method of fiber reinforced polymer. The treatments were carried out by placing Sikawrap-230C/45 strip having tensile strength of 4120 MPa, (FRP strips), with 3 mm thickness, in the direction of beam span (longitudinal direction) glued to concrete using Sikadure-330 Epoxy with tensile strength of 31.5 MPa at 7-days, at the middle span of beam at top and bottom of concrete flange with strip width 100 mm and length of 500 mm, another method was suggested by placing the FRP strips in the direction perpendicular to beam span (transverse direction) glued to concrete at the middle span of beam, using three strips each strip with 100 mm width with 100 mm gap between strips, surrounding the concrete deck along bottom, side and top of concrete flange from both sides and finally a Sikadure-52 LV Epoxy Resin having tensile strength of about 55 MPa at 4-days was injected in the cracks formed after testing, as shown in Fig. 3c-e.
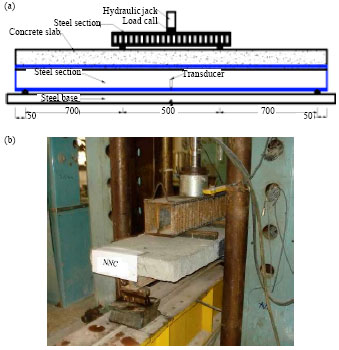 | |
| Fig. 2(a-b): | Beam test setup (Dimensions in mm), (a) Testing setup (longitudinal section) and (b) Beam testing |
| Table 6: | Testing matrix and experimental results for the original test specimens |
 | |
Therefore, each group after rehabilitation has three different types of specimens named as, (Group Name-Type of Treatment), (For example, NNF-LFS (Normal compressive strength No Fiber-treated by Longitudinal Fiber Strip), NNF-TFS (Normal compressive strength No Fiber-treated by Transverse Fiber Strip) and NNF-ER (Normal compressive strength No Fiber-treated by Epoxy Resin), etc.).
EXPERIMENTAL TESTS RESULTS
During testing of each composite beam specimens, the deflection at the mid-span of the beam started and increased gradually with the increasing of the applied load. The deflection is recorded at each load step and the slip between the concrete deck and the steel section is measured for each beam at the end of test.
The cracks were initiated at the bottom of the concrete flange in most of the specimens, at the early stage for all normal concrete groups and at more advanced stages for high strength groups, due to the higher tensile strength of concrete gained. The cracks are then extended further by increasing the applied load. The final failure modes of the specimens are the flexural failure in concrete flange after generating major cracks, as shown in Fig. 3a and b. These failure modes are gained by positioning the load to comply with the conclusions stated by Liang et al. (2005) and Zain et al. (2002).
The deflection at mid span of the original composite beam specimens of the four groups is recorded throughout loading stages up to failure of each beam. The results of the original specimens are plotted in terms of load-deflection curves, as shown in Fig. 4. The results in terms of yield force, ultimate force, deflection (δ) at ultimate stage and slip at ends at ultimate stages obtained from the original specimens tests of the four groups are listed in Table 6.
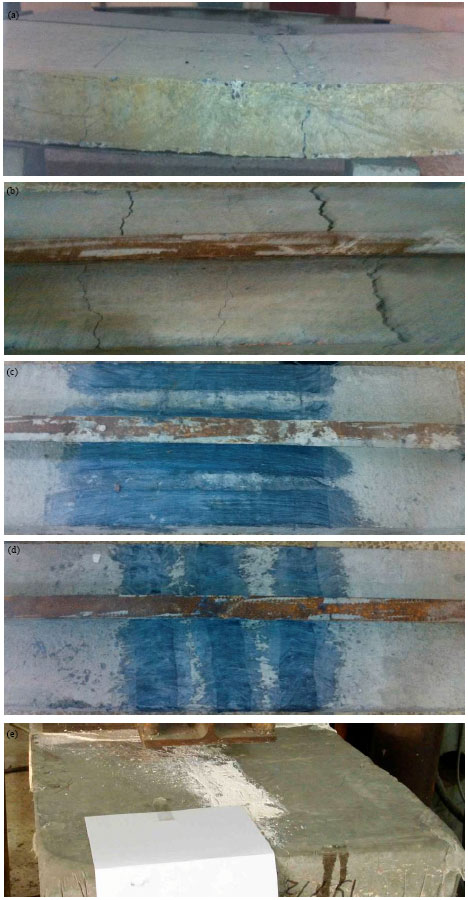 | |
| Fig. 3(a-e): | Cracks generated and treatment in concrete deck, (a) Deck’s cracks (Side), (b) Deck’s cracks (Top), (c) Longitudinal FRP strip, (d) Transverse FRP strip and (e) Epoxy resin injection |
 | |
| Fig. 4(a-d): | Load-deflection curves of the original composite beam specimens for the four groups, (a) Group NNF (original models), (b) Group NFC (original models), (c) Group HNF (original models) and (d) Group HFC (original models) |
| Table 7: | Testing matrix and experimental results for the rehabilitated test specimens |
 | |
After rehabilitations of the beams and conducting retests, the deflection at mid span of the rehabilitated specimens of the four groups is also recorded throughout loading stages up to failure of each beam. The results of the rehabilitated specimens are plotted in terms of load-deflection curves, as shown in Fig. 5. The results in terms of ultimate force, defleultimate stage and slip at ends at ultimate stages obtained from thction (δ) at e rehabilitated specimens tests of the four groups are also listed in Table 7. It was noticed that the failure of the rehabilitated specimens is due to cracks initiated away from the treated area, at the end of FRP strips and near the injected cracks. The percentages of ultimate loads, deflections and slips obtained from the reloading of each beam after rehabilitation using the three suggested methods are listed in Table 8.
DISCUSSION
The results of experimental test obtained from the original bending test for the four groups listed in Table 6 show that, the maximum average ultimate resistance of composite beam obtained by using high strength concrete deck with steel fiber (group HFC), while the average ultimate resistance of the other groups are shown to be less than the HFC group by about 1.4, 17.8 and 27.1% for groups HNF, NFC and NNF, respectively.
 | |
| Fig. 5(a-d): | Load-deflection curves of the rehabilitated composite beam specimens for the four groups, (a) Group NNF (rehabilitated models), (b) Group NFC (rehabilitated models), (c) Group HNF (rehabilitated models) and (d) Group HFC (rehabilitated models) |
| Table 8: | Percentage of ultimate load, deflection and slip with respect to original test values |
 | |
These results comply with the conclusions stated by Zain et al. (2002) which might be due to the higher tensile strength of concrete gained in HSC group and increasing of interaction due to availability of steel fibers.
The results show that the minimum average midspan deflection is obtained in group HFC and the other group gives average midspan deflection more than the HFC group by about 29.5, 9.3 and 23.1% for groups HNF, NFC and NNF, respectively. The slips at ends of beam gives a minimum values in group HFC and the other group gives average slip at ends more than the HFC group by about 18.8, 47.8 and 89.1% for groups HNF, NFC and NNF, respectively. These results agreed with the conclusion stated by Luo et al. (2012) that the concrete has the ability to transfer force after cracking (Luo et al., 2012) and the presence of fiber would enhance these ability.
After treating the damaged composite beams, the beams are reloaded and the results obtained listed in Table 7 show that the maximum average ultimate resistance load and lesser average slip at ends is obtained in group HFC, while a lesser average midspan deflection is obtained in group HNF. These results comply with the conclusions stated by Jinlong (2005), whom considered the FRP as one of the best alternatives used in strengthening concrete structures (Jinlong, 2005).
The results obtained from reloading the four group specimens listed in Table 7 are compared to the original specimen's results listed in Table 6 and the percentages of ultimate loads, midspan deflection and slip at ends with respect to the original values are listed in Table 8, for the three different methods of treatment adopted. The values listed in Table 8 show that using longitudinal FRP gives ultimate resistance ranging from 93.8 to 100.5% from the original ultimate resistance of the four groups, as well as the midspan deflection ranged from 29.5 to 84.9% from the original deflection and the slip at ends ranged from 69 to 103% from the original slip. These results might be obtained due to placing the FRP in the direction of moment and along the cracks region which comply with the finding stated by Arifovic and Taljsten (2008).
The results also show that using transverse FRP give ultimate resistance ranging from 84.4 to 95.5% from the original ultimate resistance of the four groups, as well as the midspan deflection ranged from 34.3 to 78.8% from the original deflection and the slip at ends ranged from 67 to 91% from the original slip. These results show that the FRP would be more effective if it placed in the longitudinal direction which is not considered in the reviewed literature.
The results also show that using Epoxy Resin give ultimate resistance ranged from 68.5 to 95.1% from the original ultimate resistance of the four groups, as well as the midspan deflection ranged from 21.8 to 63.7% from the original deflection and the slip at ends ranged from 90 to 110% from the original slip. These results comply with those obtained by Feilicetti and Domenico (2008), whereas new cracks were initiated after retesting of specimens.
These results show that treating composite beam using longitudinal FRP give high ultimate resistance compared with the original test results.
CONCLUSION
Using results gained from experiments, the following conclusions are stated:
| • | The ultimate resistance of the composite beam is increased by increasing compressive strength and/or adding steel fiber to concrete deck comparing with the normal concrete without steel fiber of about 1.4 to 27.1% |
| • | Using HRC with steel fiber in concrete deck would decrease deflection at midspan of about 9.3 to 29.5% as well as decrease slip at ends of composite beams of about 18.8 to 89.1% |
| • | Treating composite beam using longitudinal FRP give ultimate resistance of about 93.8 to 100.5% compared with the original test results |
| • | Treating composite beam using transverse FRP give ultimate resistance of about 84.4 to 95.5% compared with the original test results |
| • | Treating composite beam with Epoxy resin give ultimate resistance of about 68.5 to 95.1% compared with the original test results |
| • | Treating composite beam using the three methods gives an ultimate resistance with less deflection compared with the original samples |
| • | Treating composite beam using the three methods gives an ultimate resistance with less slip compared with the original samples |
However, it is recommended to investigate composite beam with different length failed in different modes and rehabilitated using FRP. Also, more detailed investigation can be conducted in the future using finite element method to predict the ultimate resistance of the composite beam rehabilitated using FRP.
ACKNOWLEDGMENT
This study is part of series of researches related to composite structures constructed and tested in Material Laboratory-Civil Engineering Department, College of Engineering, Mosul University. The authors would like to show their appreciations to the Civil Engineering laboratory staff their cooperation and the support of College of Engineering.
REFERENCES
- Aitcin, P.C. and P.K. Mehta, 1990. Effect of coarse-aggregate characteristics on mechanical properties of high-strength concrete. ACI Mater. J., 87: 103-107.
Direct Link - Kang, S.T., Y. Lee, Y.D. Park and J.K. Kim, 2010. Tensile fracture properties of an Ultra High Performance Fiber Reinforced Concrete (UHPFRC) with steel fiber. J. Compos. Struct., 92: 61-71.
CrossRef - Liang, Q.Q., B. Uy, A. Bradford and H.R. Ronagh, 2005. Strength analysis of steel-concrete composite beams in combined bending and shear. J. Struct. Engin., 131: 1593-1600.
Direct Link - Luo, Y., A. Li and Z. Kang, 2012. Parametric study of bonded steel-concrete composite beams by using finite element analysis. Eng. Struct., 34: 40-51.
CrossRef - Rahai, A.R., M.R. Saberi and R. Mahmoudzadeh, 2008. Experimental research of performance and strength of damage-concrete beams strengthening with CFRP using two different epoxies. Proceeding of the 2nd International Conference on Concrete Repair, Rehabilitation and Retrofitting, November 24-26, 2008, Cape Town, SouthAfrica.
- Zain, M.F.M., H.B. Mahmud, A. Ilham and M. Faizal, 2002. Prediction of splitting tensile strength of high-performance concrete. Cem. Concr. Res., 32: 1251-1258.
CrossRef