
Aliakbar Hedayati
Department of Fishery, Gorgan University of Agricultural Science and Natural Resources, Gorgan, Iran
LiveDNA: 98.15352
Asian Journal of Animal Sciences
Year: 2012 | Volume: 6 | Issue: 1 | Page No.: 1-12


ABSTRACT
In current study blood indices of Yellowfin Seabream, Acanthopagrus latus, were measured in order to investigate patterns of response and to quantify the extent of alterations caused by the mercury pollution. During the environmental exposure of mercury pollution in five creeks of Persian Gulf some blood characteristics were examined. Mercury concentrations were determined using a standard cold vapor atomic absorption. Numbers of Blood leukocytes and leukocyte differential count were counted under the light microscope. Hematocrit readings were performed with microhematocrit reader. Hemoglobin were determined colorimetrically. Serum glucose and total protein were measured photometrically. The range of mercury concentrations founded in the creeks water and specially sediments along the Mahshahr coast was higher than other marine environment. It was declared that MCHC; leukocyte count, neutrophil lymphocyte and total protein can consider as biomarker of mercury pollution in yellowfin seabream.
PDF Abstract XML References Citation
Received: August 06, 2011;
Accepted: November 01, 2011;
Published: December 29, 2011
How to cite this article
Aliakbar Hedayati, 2012. Effect of Marine Mercury Toxicity on Immunological Responses of Seabream. Asian Journal of Animal Sciences, 6: 1-12.
DOI: 10.3923/ajas.2012.1.12
URL: https://scialert.net/abstract/?doi=ajas.2012.1.12
DOI: 10.3923/ajas.2012.1.12
URL: https://scialert.net/abstract/?doi=ajas.2012.1.12
INTRODUCTION
Physiological stress indicators such as some hematological and blood parameters could be useful to evaluate the effects of contaminants such as heavy metals in fish but the application of these findings to preparation of environmental diagnoses will need a more detailed investigation and must be validated in situ before establishing them as biomarkers (Ribeiro et al., 2006).
The finding of suitable biomarkers for the best possible diagnoses is very critical for ecotoxicological studies. Blood indices are considered pathophysiological parameters of the whole body and therefore are important in diagnosing the structural and functional status of fish exposed to xenobiotics (Adhikari et al., 2004).
Although fish blood indices have been increasingly examined in ecosystem monitoring programs as valuable parameters of physiological changes in the presence of xenobiotics, the lack of basic knowledge about the blood response to stressors mainly from tropical species is the most important leakage to using these indices in environmental monitoring programs (Affonso et al., 2002).
Physiological changes induced by xenobiotics are also apparent at the biochemical and physiological level, such as in the carbohydrate and protein metabolism and in hematology. In cases where these alternations are adaptive they are referred to as stress responses, while they are considered effects when they have a negative cause on the physiological condition or even survival of the fish (Barton and Iwama, 1991).
Hematotoxins change quantitative and qualitative characteristics of blood cells to produce toxic symptoms. Hematotoxicity happen when some of these different blood components are present or structural anomalies occurring in blood components interfere with normal functioning.
Several biochemical and physiological responses occur when a fish exposed to the xenobiotics, if fish can not tolerate and acclimatized it may lead to toxicity (Begun, 2004). Fish blood is sensitive to pollution-induced stress and changes in the hematological and metabolic parameters can be used as toxicity indices of xenobiotics (Sancho et al., 2000).
Glucose is a carbohydrate that has a major role in the bioenergetics of animals, being transformed to chemical energy (ATP) which in turn can be expressed as mechanical energy (Lucas, 1996). Levels of glucose were measured as conventional stress markers to assess the reliability of stress response triggered under our test condition.
Most biochemical defenses respond to cellular injury by increasing levels of defenses through self-regulating signal transduction mechanisms. These defenses are usually proteins that serve numerous cellular functions (Safahieh et al., 2010). Thus, measuring these systems may provide early warning of danger to the cell as well as help elucidate potential mechanisms of cellular injury.
To date, little is known about the blood parameters of stressed fish. In current study blood biomarkers were measured in order to investigate patterns of response and to quantify the extent of alterations caused by the mercury pollution, so in this study, a multi factorial approach, involving determination of bloods parameters along with serum metabolites during the environmental exposure of mercury pollution was used. The information gained from this study may be useful for future strategies in monitoring and predicting the effects of mercury exposure and also in developing indices to measure stress during sea bream culture.
MATERIALS AND METHODS
Environmental test: In natural condition, at first with mercury analysis of water and sediment (method details in bellow) of 26 creeks in Mahshahr region (northwest of Persian Gulf) (Fig. 1) we choose four more pollutant (Jafari, Ghazaleh, Majidieh and Petroshimi) and one less pollutant creeks (Zangi).
For every creek we choose three station and in every station one water and sediment sample collected, also two yellowfin sea bream with the same size (200 g) and same sex (all immature male) were caught.
Mercury analysis: In laboratory water samples were filtered with Millipore strainer mesh size 0.45 μm, the filtrate was then acidified with 2 mg L-1 of 20% K2Cr2O7 (w/v) prepared at nitric acid (American Public Health Association, 2005) and soluble store at -4°C until mercury analyses.
For stabilization of weight, the sediments were freeze-dried (Shi et al., 2005), then were sieved through 63 μ mesh and were allowed to settle, the supernatant water decanted and homogenized, finely powdered sediment subsamples were dissolved in 60 mL container 4 mL of concentrated nitric acid and 2 mL of concentrated sulfuric acid. The mixture was digested at 90°C for l-2 h in hot plate. Upon cooling, 1 mL K2Cr2O7 or 0.5 mL BrCl was added. The solution was filtered using Whatman No. 1 filter paper and diluted to 50 mL with deionized water (Moopam, 1999) and preserved prior to Hg analysis.
Mercury concentrations were determined by the Department of Marine Chemistry Laboratory, Khorramshahr University of Marine Science and Technology using a standard cold vapor atomic absorption (CV-AAS) method (Unicam 919) equipped with Hg cold vapor generator (VGA 77) (EPA, 1992).
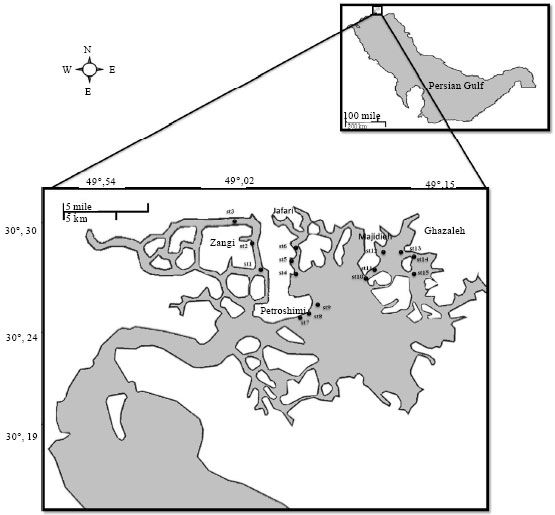 | |
| Fig. 1: | Environmental test area |
Blood sampling: To obtain blood samples, fish were quickly taken out from the water and held firmly on a bench with a cloth covering the head and blood was withdrawn from caudal vessels (Savari et al., 2010) were for hematology and leukocyte analysis and the second were centrifuged to obtain serum. The serums were separated into aliquots and were frozen and stored at -80°C until metabolite analyses.
Hematological analysis: Numbers of Blood leukocytes (Lk count 104 cells mL-1) was performed by diluting heparinized blood with Giemsa stain at 1:30 dilution and cells were counted using a hemocytometer Neubauer under the light microscope (Stevens, 1997).
The leukocyte differential count was made in peripheral blood smears stained by Merck Giemsa (Beutler et al., 2001), giving the Neutrophils value of differential neutrophils (100 leukocytes count) and the Mononuclear value of differential lymphocytes plus monocyte and eosinophile (100 leukocytes count).
Blood centrifuged in a microhematocrit centrifuge (Hettich, Germany) then measuring the packed cell volume (Beutler et al., 2001). Hematocrit readings were performed with the aid of a microhematocrit reader.
Hemoglobin levels (Hb mg L-1) were determined colorimetrically by measuring the formation of cyanomethemoglobin according to Lee et al. (1998).
MCHC Mean cell hemoglobin concentration; relative quantity of Hb per erythrocyte; measured directly from the optical properties of the cell, or derived as MCHC (mg L-1) = Hb (mg dL-1)/Ht (ratio) (Evans, 2008).
Metabolite analyses: Serum glucose was measured photometrically according to a method modified from Banauch et al. (1975) based on the quantification of NADH after a glucose oxidation catalyzed by glucose dehydrogenase. The quantity of NADH formed is proportional to the glucose concentration.
Serum total protein levels were determined using Pars Azmoon, Iran (1 500 028) kit, with bovine serum albumin serving as standard by the method of Lowry at 546 nm and 37°C (Hedayati et al., 2010).
Statistical procedures: For each biomarker, the data were tested for normality and homogeneity. One-way analysis of variance ANOVA with Duncan Post Hoc was used to determine significant differences to evaluate the effect of mercury on parameters. To investigate associations between bioaccumulation and its effects, Pearson correlation coefficients (r) were calculated between mercury concentrations and blood parameters. The differences between means were analyzed at the 5% probability level. Data are reported as mseans±standard deviation ![]() . The software SPSS, version 11.5 (SPSS, Richmond, Virginia, USA) was used as described by Dytham (1999).
. The software SPSS, version 11.5 (SPSS, Richmond, Virginia, USA) was used as described by Dytham (1999).
RESULTS
Mercury: In different creeks significant differences were found between the sampling stations. The range of mercury concentrations found in the creeks water and specially sediments along the Mahshahr coast was high. From the stations it was possible to observe a gradient of metal contamination. Station Zangi had lower levels of mercury contamination in all measurements and choose as clean station. Other Stations had higher levels of mercury contamination in allmeasurements and were choosed as infected station. Stations Majidieh and Petroshimi were noticeably close to an area of industrial activities (oil and petrochemistry, respectively) and higher amount were predictable.
The analytical data were normalized to the distance from the creeks with water and sediment mercury (Fig. 2). Concentrations of both water and sediment mercury were strongly higher in infected creeks than the clean one, however this increase in water mercury was realizable. In general, the highest concentrations of mercury for water and sediment had same progress. These observations strongly suggest that anthropogenic activities can significantly increased mercury levels in the water and sediment even in closed creek. These differences denote a contamination gradient according to the distance to the point source of mercury into the system, Petroshimi and Majidieh being the closest and Zangi and Jafari the furthest creeks to the anthropogenic activities near the Mahshahr coast.
Hematological and immunological analysis: All indices exhibited high significant analysis of variance (p<0.05) except differential eosinophils (Table 1). Environmental result declared significance increase of differential monocyte and neutrophil within higher considerable values than those of the control group, beside significance decrease of Hb, Ht, leukocyte count, differential lymphocyte, eosinophyle and MCHC (p>0.05) with lower considerable values than those of the control group.
 | |
| Fig. 2: | Environmental concentration of mercury chloride (μg L-1) in the water and sediment of different creeks in Mahshahr coast with different source of pollutant (box plots contain mean and standard deviation) |
| Table 1: | Environmental hematological and immunological activities of yellowfin seabream exposed to water mercury |
 | |
| Different alphabets with all the values within same row indicates significant difference at p>0.05 | |
| Table 2: | Environmental correlation of hematological and immunological activities of yellowfin seabream with water mercury |
 | |
| *Correlation is significant at the 0.05 level, ** Correlation is significant at the 0.01 level | |
Correlation coefficients between water mercury concentrations and hematological and immunological indices were significant in Hb, Ht, Monocyte, Neutrophil and Eosinophils (p<0.05), that among significant parameters Monocyte, Neutrophil, Eosinophils were positive and Hb, Ht correlation were negative in correlate with water mercury and among insignificant indices only Monocyte had positive and other indices had negative correlation (Table 2).
Result of sediment correlation show only Leukocyte had significant negative correlate whereas within insignificant parameter Hb, MCHC, Monocyte and Eosinophils had positive correlation with sediment mercury and Ht, Lymphocyte and Neutrophil had negative correlation (Table 3).
 | |
| Fig. 3: | Metabolites response (Glucose and Total protein) of the yellowfin seabream during environmental exposed to different concentration of mercury chloride (box plots contain mean and standard deviation for glucose, beside line chart for total protein) |
| Table 3: | Environmental correlation of hematological and immunological activities of yellowfin seabream with sediment mercury |
 | |
| *Correlation is significant at the 0.05 level | |
| Table 4: | Environmental correlation of metabolites activities of yellowfin seabream with water mercury |
 | |
| *Correlation is significant at the 0.05 level | |
| Table 5: | Environmental correlation of metabolites activities of yellowfin seabream with sediment mercury |
 | |
| *Correlation is significant at the 0.05 level | |
Biochemical analysis: Values recorded for activity of total protein show significant depletion in infected creeks with respect to clean creek. Glucose was significantly increased in infected creeks with respect to clean creek (Fig. 3).
Correlation coefficients between water mercury concentrations and biochemical indices wasn’t significant (p<0.05), however both correlation were negative in correlate with water mercury (Table 4). Result of sediment correlation show only glucose had significant positive correlate whereas glucose parameter had negative correlation with sediment mercury (Table 5).
DISCUSSION
The range of mercury concentrations founded in the creeks water and specially sediments along the Mahshahr coast was higher than other marine environment, so it reveals that is an area requiring a special concern in order to avoid future environmental problems.
Correlation results and analytical results show that there weren’t high correlation between surrounded mercury and candidate indices and all indices show admissible correlate in total condition. So eventually it was declared that between hematological indices MCHC gain suitable qualification to become a suitable biomarker and between immunological indices leukocyte count, neutrophil and lymphocyte can consider as suitable and effective biomarker of mercury pollution in yellowfin seabream. Also between metabolite indices we can introduce Total protein as suitable and effective biomarker of mercury pollution.
The most common hematology findings in toxicology studies are mild decreases in RBC count, hemoglobin concentration and hematocrit. Although specific mechanisms for the erythrocyte effects are typically not identified, there appears to be a generalized reduction of anabolic processes, including erythropoiesis. Decreased physical activity and correspondingly decreased tissue oxygen demand can also contribute to reduced erythropoiesis (Gad, 2007). For example, Palackova et al. (1994) found an elevation in both parameters after exposure to Cadmium. Therefore, the effects of heavy metal on these two blood parameters appear variable and dependent on the exposure scenario and acclimatization conditions of the fish (Smet and Blust, 2001).
In anemic animals, decreases in RBC count and hematocrit that approximate the proportionate decrease in hemoglobin are typically observed. Decreases in red cell parameters may be caused by hemorrhage, hemolysis, or decreased kidny production. Hyperbilirubinemia, hemogolbinemia and hemoglobinuria (the latter two with intravascular hemolysis only) may be associated with hemolytic anemia but not with anemia of decreased production or blood loss (Haschek et al., 2009).
The most common cause of relative polycythemia, increased RBC count, is simple dehydration which causes systemic hypoxia and trigger erythropoietin production. A similar mechanism occurs with systemic alkalosis. By increasing the affinity of hemoglobin for oxygen, alkalosis causes the renal tissue sensors to detect hypoxia, triggering erythropoietin production (Gad, 2007).
Some toxicants (e.g., heavy metals) can cause RBCs to be released from the kidny. Proportionate increases in red cell numbers, hemoglobin, or hematocrit generally reflect hemoconcentration and dehydration (Haschek et al., 2009).
An intracellular Mean Cell Hemoglobin Concentration (MCHC) of approximately 0.34 mg L-1 appears to be an important factor that limits cell divisions and this MCHC value of approximately 0.34 mg L-1 is found across all of the healthy adult common laboratory animals, whereas other erythrocytic parameters differ more between species (Evans, 2008).
Ribeiro et al. (2006) find no significant effects in MCHC for all tested metals in fish Hoplias malabaricus. This parameter reflect increased production and release of reticulocytes that are larger in size and have decreased hemoglobin content compared to mature RBCs (Haschek et al., 2009). The chemicals that stimulate blood cell/hemoglobin production, generally induce a hypoxic condition in fish that stimulated the spleen which produces the blood cells in fish (Fange, 1992), to contract and release stored erythrocytes into the circulation.
Increased significantly the values of hematocrit after subchronic exposure, indicating the importance of the route of contamination. Results observed accord with those of Chowdhury et al. (2004), who noted an increase of blood hematocrit and hemoglobin during environmental hypoxia and chronic to waterborne metals to increase blood oxygen carrying capacity when impairment of gas exchange occurs.
Although environmental conditions such as suboptimal temperatures or nutritional state could be responsible for the suppression of immune responses (Mattsson et al., 2001) and for the high blood hematocrit and high hemoglobin values in fish (Cole et al., 2001), many authors have recently described the use of hematological endpoints as reasonable biomarkers of fish health (Affonso et al., 2002; Cole et al., 2001).
The cell population numbers may be increased and termed cytosis or philia; reductions of cell numbers are termed penia. Our result show decreased in lymphocyte and eosinophils in contrast to increase of monocyte and neutrophil during mercury exposure, so Lymphocytopenia, Eosinopenia versus Monocytosis and Neutrophilia were happened in current results that bellow are explained. A stress-induced leukocyte response refers to a combination of changes observed in animals receiving corticosteroids or producing increased endogenous corticosteroids because of some stressful condition. It generally consists of neutrophilia, lymphopenia and sometimes monocytosis depending on the animal species. The neutrophilia develops as a consequence of increased release of segmented cells from the kidny storage pool, decreased margination of cells, decreased movement of cells into tissues and increased stability of lysosomal membranes (Gad, 2007). Lymphopenia results from steroid-induced lysis and cell redistribution. Eosinopenia develops as a result of decreased production and release from the kidny (Evans, 2008). Monocytosis, when it occurs, is thought to result from mobilization of marginated cells. It is interesting that the stress-induced leukocyte response is a relatively infrequent finding in toxicology studies even though the study design or the test material often creates physical conditions that appear to be quite stressful (Gad, 2007).
It is believed that neutrophils and monocytes have phagocytic activity which might explain their increased percentage during infectious situations. Lee et al. (1998) also found an increase of neutrophil counts in channel catfish exposed to high doses of potassium permanganate.
Adhikari et al. (2004) find a reduction in some immunological parameters (leukocyte and lymphocyte counts) and the increase in neutrophil and monocyte percentages were demonstrated in HgCl2 exposed.
It is known that mercury can induce abnormal responses in the immune system, including leukocyte count, a marker of cellular defense (Beutler et al., 2001). The increase in neutrophil and monocyte percentages which represents the activity of the first and second lines of defense against the cellular damage, has been reported after mercury exposure (Elia et al., 2003).
Ribeiro et al. (2006) confirmed significant decrease of mononuclear (differential lymphocytes plus monocytes) and significant increased of differential neutrophil to methyl mercury and inorganic lead.
It is known that changes in leukocyte counts after exposure to pollutants may be associated to a decrease in nonspecific immunity of the fish. Ribeiro et al. (2006) show decrease of leukocytes count to inorganic lead in fish Hoplias malabaricus.
According to Wedemeyer et al. (1990), the suppression of the immune system increases the susceptibility to diseases in fish, a very important aspect considering the presence of heavy metals in natural ecosystems as a result of human activities. However, results of leukocyte count in pollution exposure are different and some researcher show decrease of leukocyte count in exposure, like our study (Evans, 2008) for Thomomys talpoides and Lopes et al. (2001) for Apodemus sylvaticus.
Lohner et al. (2001) find Leukopenia (reduced Leukocyte counts) and increase in both Neutrophils and Monocyte of Sunfish Populations (Lepomis sp.) in different creeks.
WBC abundance provides an indication of fish health and a high WBC count may indicate a subclinical infection. An extremely low WBC count indicates either suppression of circulating lymphocytes, a characteristic acute stress response, or that an active bacterial infection has induced leukocytolysis (Evans, 2008).
Result of current study show same progress of biochemical indices in both test condition with elevation in glucose and depletion in total protein (Hyperglycemia and Hypoproteinemia, respectively).
The most frequently encountered causes of hyperglycemia are failure to fast an animal and catecholamine release secondary to excitement or fear (Gad, 2007). In suboptimum or stressful conditions (internal or external) the chromaffin cells release catecholamine hormones, adrenaline and noradrenaline toward blood circulation (Reid et al., 1998). Those stress hormones in conjunction with cortisol mobilize and elevate glucose production in fish through glucogenesis and glycogenolysis pathways (Iwama et al., 1999) to cope with the energy demand produced by the stressor, Glucose is then released toward blood circulation and enters into cells through the insulin action (Nelson and Cox, 2005).
Levels of glucose often increase during the first phase of the stress response due to an elevated breakdown of glycogen (Wendelaar-Bonga, 1997). Significant increases in glucose were observed as a result of toxic effect of Cu (Abdel-Tawwab et al., 2007). These results may be attributed to the hepatocellular damage. The plasma glucose concentration of gilthead sea bream exposed to acute confinement was increased (Saera-Vila et al., 2009). From aspect of increase, our observations show no disagreement with the literature values.
Under stress situations may constitute a physiological mechanism with an important role in providing energy to cope with the stress situation. Therefore, depletion of total protein (hypoproteinemia) content might also be attributed to the destruction or necrosis of cellular function and consequent impairment in protein synthetic machinery (David et al., 2004). When an animal is under toxic stress, diversification of energy occurs to accomplish the impending energy demands and hence the protein level is depleted (Neff, 1997). The depletion of total protein content may be due to breakdown of protein into free amino acid under the effect of mercury chloride at the lower exposure period (Shakoori et al., 2004).
Some studies indicate a decrease in total protein content during heavy metal exposure. Such decreases were, for example, found in the edible crab Scylla serrata exposed to cadmium or in the freshwater fish Sarotherodon mossambicus and the common carp exposed to mercury (Canli, 1996). Depletion in the protein content of the Catla catla exposed to mercury chloride sub-lethal concentrations were estimated (Prasath and Arivoli, 2008).
The major findings of this study are that mercury is a toxic substance in yellowfin sea bream, with many severs change on blood parameters to various concentrations. Results of the present investigation indicated that chronic mercury concentrations tested may cause several changes in the hematological and metabolite parameters of the studied fish and we can use these changes as biomarkers of mercury detection.
ACKNOWLEDGMENT
The authors are thankful to the Iranian National Science Foundation (INSF) with grant number 88000678 for providing financial support and necessary facilities.
REFERENCES
- Abdel-Tawwab, M., M.A.A. Mousa and F.E. Abbass, 2007. Growth performance and physiological response of African catfish, Clarias gariepinus (B.) fed organic selenium prior to the exposure to environmental copper toxicity. Aquaculture, 272: 335-345.
CrossRefDirect Link - Adhikari, S., B. Sarkar, A. Chatterjee, C.T. Mahapatra and S. Ayyappan, 2004. Effects of cypermethrin and carbofuran on certain hematological parameters and prediction of their recovery in a freshwater teleost, Labeo rohita (Hamilton). Ecotoxicol. Environ. Saf., 58: 220-226.
CrossRefPubMedDirect Link - Affonso, E.G., V.L.P. Polez, C.F. Correa, A.F. Mazon, M.R.R. Araujo, G. Moraes and F.T. Rantin, 2002. Blood parameters and metabolites in the teleost fish Colossoma macropomum exposed to sulfide or hypoxia. Comp. Biochem. Physiol. C Toxicol. Pharmacol., 133: 375-382.
CrossRefDirect Link - Banauch, D., W. Brummer, W. Ebeling, H. Metz and H. Rindfrey et al., 1975. A glucose dehydrogenase for the determination of glucose concentrations in body fluids. Z. Klin. Chem. Klin. Biochem., 13: 101-107.
PubMedDirect Link - Barton, B.A. and G.K. Iwama, 1991. Physiological changes in fish from stress in aquaculture with emphasis on the response and effects of corticosteroids. Ann. Rev. Fish Dis., 1: 3-26.
CrossRefDirect Link - Begum, G., 2004. Carbofuran insecticide induced biochemical alterations in liver and muscle tissues of the fish Clarias batrachus (Linn) and recovery response. Aquat. Toxicol., 66: 83-92.
CrossRefPubMedDirect Link - Canli, M., 1996. Effects of mercury, chromium and nickel on glycogen reserves and protein levels in tissues of Cyprinus carpio. Turk. J. Zool., 20: 161-168.
Direct Link - Chowdhury, M.J., D.G. McDonald and C.C. Wood, 2004. Gastrointestinal uptake and fate of cadmium in rainbow trout acclimated to sublethal dietary cadmium. Aquat. Toxicol., 69: 149-163.
CrossRefDirect Link - Cole, M.B., D.E. Arnold, B.J. Watten and W.F. Krise, 2001. Haematological and physiological responses of brook charr, to untreated and limestone-neutralized acid mine drainage. J. Fish Biol., 59: 79-91.
CrossRefDirect Link - David, M., S.B. Mushigeri, R. Shivakumar and G.H. Philip, 2004. Response of Cyprinus carpio (Linn) to sublethal concentration of cypermethrin: Alterations in protein metabolic profiles. Chemosphere, 56: 347-352.
CrossRefPubMedDirect Link - Elia, A.C., R. Galarini, M.I. Taticchi, A.J. Dorr and L. Mantilacci, 2003. Antioxidant responses and bioaccumulation in Ictalurus melas under mercury exposure. Ecotoxicol. Environ. Saf., 55: 162-167.
CrossRefDirect Link - Iwama, G.K., M.M. Vijayan, R.B. Forsyth and P.A. Ackerman, 1999. Heat shock proteins and physiological stress in fish. Am. Zool., 39: 901-909.
CrossRefDirect Link - Lopes, P.A., T. Pinheiro, M.C. Santos, M. da Luz Mathias, M.J. Collares-Pereira and A.M. Viegas-Crespo, 2001. Response of antioxidant enzymes in freshwater fish populations (Leuciscus alburnoides complex) to inorganic pollutants exposure. Sci. Total Environ., 280: 153-163.
CrossRefPubMedDirect Link - Mattsson, K., K.J. Lehtinen, J. Tana, J. Hardg, J. Kukkonen, T. Nakari and C. Engstrom, 2001. Effects of pulp mill effluents and restricted diet on growth and physiology rainbow trout (Oncorhynchus mykiss). Ecotoxicol. Environ. Saf., 49: 144-154.
CrossRefDirect Link - Neff, J.M., 1997. The ecotoxicology of arsenic in the marine environment. Environ. Toxicol. Chem., 16: 917-927.
CrossRefDirect Link - Oliveira Ribeiro, C.A., F.F. Neto, M. Mela, P.H. Silva and M.A.F. Randi et al., 2006. Hematological findings in neotropical fish Hoplias malabaricus exposed to subchronic and dietary doses of methylmercury, inorganic lead and tributyltin chloride. Environ. Res., 101: 74-80.
CrossRefDirect Link - Prasath, P.M.D. and S. Arivoli, 2008. Biochemical study of freshwater fish catla catla with reference to mercury chloride. Iran. J. Environ. Health Sci. Eng., 5: 109-116.
Direct Link - Reid, S.G., N.J. Bernier, S.F. Perry, 1998. The adrenergic stress response in fish: Control of catecholamine storage and release. Comp. Biochem. Physiol. Part C: Pharmacol. Toxicol. Endocrinol., 120: 1-27.
CrossRefDirect Link - Saera-Vila, A., J.A. Calduch-Giner, P. Prunet and J. Perez-Sanchez, 2009. Dynamics of liver GH/IGF axis and selected stress markers in juvenile gilthead sea bream (Sparus aurata) exposed to acute confinement Differential stress response of growth hormone receptors. Comp. Biochem. Physiol. Part A: Mol. Integr. Physiol., 154: 197-203.
CrossRefPubMedDirect Link - Safahieh, A., A. Hedayati, A. Savari and A. Movahedinia, 2010. Effect in vitro exposure of mercury chloride on phosphatase enzymes in Yellowfin sea bream (Acanthopagrus latus). Am. Eurasian J. Toxicol. Sci., 2: 208-214.
Direct Link - Sancho, E., J.J. Ceron and M.D. Ferrando, 2000. Cholinesterase activity and hematological parameters as biomarkers of sublethal molinate exposure in Anguilla anguilla. Ecotoxicol. Environ. Saf., 46: 81-86.
CrossRefDirect Link - Savari, A., A. Hedayati, A. Safahieh and A. Movahedinia, 2010. Determination of some enzymatic indices of Yellowfin sea bream (Acanthopagrus latus) in Mahshahr creeks (North West of Persian Gulf). World J. Fish Mar. Sci., 2: 475-480.
Direct Link - Shi, J.B., L.N. Liang, G.B. Jiang and X.L. Jin, 2005. The speciation and bioavailability of mercury in sediments of Haihe River, China. Environ. Int., 31: 357-365.
PubMedDirect Link - Smet, de H. and R. Blust, 2001. Stress responses and changes in protein metabolism in Carp Cyprinus carpio during cadmium exposure. Ecotoxicol. Environ. Safety, 48: 255-262.
CrossRef - Bonga, S.E.W., 1997. The stress response in fish. Physiol. Rev., 77: 591-625.
CrossRefPubMedDirect Link - Hedayati, A., A. Safahieh, A. Savar and J.G. Marammazi, 2010. Assessment of aminotransferase enzymes in Yellowfin sea bream (Acanthopagrus latus) under experimental condition as biomarkers of mercury pollution. World J. Fish Mar. Sci., 2: 186-192.
Direct Link