
Devendra K. Payasi
Jawaharlal Nehru Krishi Vishwavidyalaya, Regional Agriculture Research Station, Sagar, 470002, Madhya, Pradesh, India
International Journal of Plant Breeding and Genetics
Year: 2015 | Volume: 9 | Issue: 3 | Page No.: 177-188


ABSTRACT
Sixty four powdery mildew disease tolerant genotypes of mungbean were grown under All India Coordinated Research Project on Mullarp, during kharif, 2004 and rabi, 2004-05 in randomized complete block design with three replication to compare their performance, existing variability among various yield related traits. Analysis of variance showed significant variation for days to 50% flowering, days to maturity, plant height, number of primary branches plant–1, number of clusters plant–1, number of pods cluster–1, pod length, number of seeds pod–1, number of pods plant–1, 100 seed weight, hard seed percent, protein content, phenol content and seed yield plant–1. High heritability coupled with high genetic advance as percentage of mean was observed for seed yield plant–1, number of primary branches, number of clusters plant–1 and plant height. Direct selection for the traits possessing additive genetic variance, which is fixable in nature, may lead to development of desirable mungbean plant.
PDF Abstract XML References Citation
Received: May 18, 2015;
Accepted: July 08, 2015;
Published: July 28, 2015
How to cite this article
Devendra K. Payasi, 2015. Genetic Variability Analysis for Seed Yield and its Components in Mungbean (Vigna radiata L. Wilczek). International Journal of Plant Breeding and Genetics, 9: 177-188.
DOI: 10.3923/ijpbg.2015.177.188
URL: https://scialert.net/abstract/?doi=ijpbg.2015.177.188
DOI: 10.3923/ijpbg.2015.177.188
URL: https://scialert.net/abstract/?doi=ijpbg.2015.177.188
INTRODUCTION
Vigna, a pantropical genus comprises about 150 species, most of which are found in Asia and Africa. Only seven species of Vigna are cultivated as pulse crop of which two are African and five are of Asiatic origin, in which Mungbean (Vigna radiata L. Wilczek) is an ancient and well known crop in Asia particularly in the Indian subcontinent and now becoming popular in other continents (Rehman et al., 2009). It has the diploid chromosome number 2n = 2x = 22 (Karpechenko, 1925). It is an excellent source of easily digestible high quality protein for the predominant vegetarian population of India. It contains 22-28% total protein, 21-25% of total amino acid and 1.53-2.63% lipids, 1.0-1.5% fat, 3.5-4.5% fiber, ash contents ranges from 4-5% and 59-65% carbohydrate on dry weight basis and provide 334-344 kcal energy (Srivastava and Ali, 2004).
India is the largest producer of mungbean, contributing 65% by area and 54% by production towards global mungbean production. In India, it is cultivated in about 2.71 million hectares with the production of 1.19 million ton. However, the national productivity remains low 469 kg ha–1 (Anonymous, 2013). Low yield and poor stability remains one of the most important constraints facing in its expansion due to poor genetic makeup of the cultivars, Since it is a short duration legume, it fit well in to many cropping systems under rainfed and irrigated conditions and increase small farmer’s Income and improve soil fertility. In Madhya Pradesh area occupies 87.7 thousand hectares with total production of 40.9 and productivity of 407 kg ha–1 (Anonymous, 2013).
Exploration of the genetic variability in the germplasm of crop species is considered to be the key point for making further genetic improvement in yield as well as other economically important traits. The knowledge of heritability and genetic advance guide the breeders to select superior parents to initiate and effective and fruitful crossing programme. In mungbean large amount of genetic variability has been reported (Pandiyan et al., 2006; Ghosh and Panda, 2006), which indicates the potential for genetic improvement. The knowledge of heritability and genetic advance guides the plant breeders to select superior parents to initiate an effective and fruitful crossing programme.
MATERIALS AND METHODS
A set of 64 powdery mildew disease tolerant genotypes of diverse origin were grown in Randomized Block Design replicated thrice with a 30 and 10 cm row to row and plant to plant spacing, respectively. The soil type was vertisol. Fertilizer applied at the ratio of 20:40:20 kg NPK ha–1. Date of Sowing July 14, 2004 and 30 March in kharif and rabi, respectively. The experiment was conducted under All India Coordinated Research Project on Mullarp, Department of Plant Breeding and Genetics, Indira Gandhi Agricultural University, Raipur, Chhattisgarh during kharif 2004 and rabi 2004-05. Standard agronomic practices were followed from sowing till harvest in each season. The same cultural operations including hoeing, weeding, irrigation, fertilizer were carried out to reduce experimental error. Observations were recorded as follows:
Observations on various metric traits were recorded on five competitive plants from each genotype at the time of maturity. Phenological observations were recorded on lot basis. The mean data were used in analysis. Protein content in dried seeds of each genotype was estimated by estimation of nitrogen content using Gerhart digestion and distillation (Microkjeldhal) method (AOAC) as described below:
Estimation of protein content: Protein content in dried seeds of each genotype was estimated by estimation of nitrogen content using Gerhart digestion and distillation (Microkjeldhal) method (AOAC). In which, oven dry seeds were ground in Wally grinder and 0.25 g of powdered sample (Mesh-200) was taken into digestion tube and 3 g digestion mixture (Potassium sulphate:copper sulphate, 10:1) was added to it. There after 5 mL concentrate sulphuric acid was added and kept for over night for uniform digestion. Test tubes thus, filled up with digested material were placed into Gerhart digestion apparatus and raised the temperature up to 450°C for one and a half hour or till the digested material become colourless. A blank (without sample) was also run simultaneously under identical condition. After cooling the digested material of all the tubes containing digested samples were placed in Gerhart distillation system. A programme was made for adding 10 mL water, 30 mL sodium hydroxide (40%) and recommended reaction time was 10 sec. Distillation process completed within three minutes to liberate ammonia, which was absorbed into 10 mL of boric acid. Indicator turned to purple green colour indicating the completion of digestion. The absorbed ammonia gas was determined by titration with primary standard solution of sulphuric acid by using burette (SE±0.01). Estimated nitrogen values of replicated samples were converted into protein content (%) by multiplying a factor 6.25 for pulses protein.
Estimation of phenols: Total phenols present in the seeds of each genotype were estimated. In which plant sample (grain powder) 0.1 g was taken for the extraction in 7 mL 80% alcohol borate buffer (0.2 m, pH 7.6) with the help of mortar and pestle at room temperature under dark condition. The entire extracted content was centrifuged at 3000 rpm for 15 min, repeatedly. The extracted sample was finally made to 7 mL with borate buffer and from this aliquot sample was used for the estimation of phenol.
RESULTS AND DISCUSSION
Analysis of variance: Variation refers to observable differences among individuals for a particular trait. The data collected on different traits were analyzed and presented in Table 1. Analysis of variance showed significant variation for days to 50% flowering, days to maturity, plant height, number of primary branches plant–1, number of clusters plant–1, number of pods cluster–1, pod length, number of seeds pod–1, number of pods plant–1, 100 seed weight, hard seed (%), protein (%), phenol content and seed yield plant–1. This clearly indicates the presence of considerable variability among the sixty four genotypes of mungbean used in the present investigation for all the characters studied and provides an opportunity for further analysis and estimation of parameters of variability.
Estimation of genetic variability: The basic study in any crop improvement programme depends on proper existence of variability and the knowledge related to its nature. In present investigation, the significant variability was observed for all the characters indicating existence of sufficient variability providing better chances of selection of parents for hybridization and/or direct selection for yield improvement. Since, there is no direct way to study the genotypic expression at field level, this can only be done through phenotypic expression, which is the result of an interaction of genotype and environment.
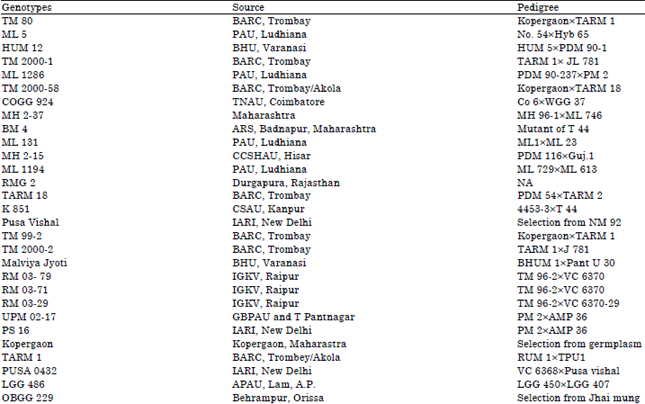
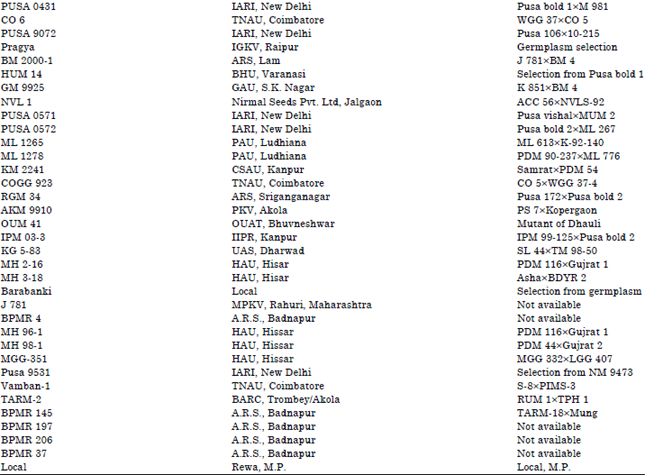
| Table 1: | List of mungbean genotypes used for genetic variability analysis |
  | |
The success of a breeder in selecting genotypes possessing higher yield depends largely on the existence and exploitation of genetic variability to the full extent. Estimation of heritability have been made in broad sense, which induce variation due to all types of gene expressions. The expected genetic advance based on heritability estimates is influenced by the unit of measurement of characters. Hence, comparison of genetic advance estimates for various characters will be meaningless. In order to avoid, this complication and to facilitate the comparison of progress for various characters genetic advance, as percentage over mean was calculated and discussed here.
Mean performance of genotypes: Mean performance and range of different characters achieved in the population of mungbean are presented in Table 2. Days to 50% flowering ranged from 26.65-40.30 days, with a mean performance of 35.68 days. Genotype K-851 (40.30 days) required maximum days for 50% flowering followed by ML 1286 (38.60 days) and UPM 02-17(38.22 days). However, genotype MH 2-16 (26.60 days) requires minimum days for 50% flowering followed by Pusa 0571 (28.50 days) and BPMR 206 (28.60 days). Significant differences recorded for days to 50% flowering. Genotype K-851 required maximum and genotype MH 2-16 required minimum days to 50% flowering. Variability in days to 50% flowering is also reported by several previous workers i.e., Reddy (1997), Reddy et al. (2004) and Siddique et al. (2006). Days to maturity ranges from 61.23-83.53 days, with a mean performance of 71.27 days.
| Table 2: | Genetic parameters of variations for seed yield and its components in mungbean |
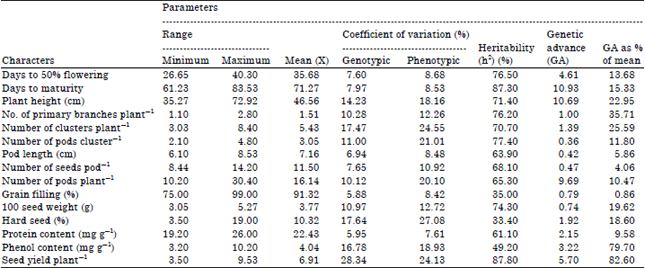 | |
Genotypes Pusa 9531 (83.53) observed maximum days for maturity of crop followed by TARM 2 (82.20) and J 781 (81.30). However, KG 5-83 (61.23) recorded minimum days for maturity followed by KM 2241 (61.69) and NVL-1 (62.23). Days to maturity exhibited significant differences among the test genotypes. Maximum days to maturity was recorded for Pusa 9531, whereas, it was minimum for K 95-83. Variations in maturity of genotypes were observed by previous workers i.e., Tiwari et al. (1996), Rao et al. (2006) and Siddique et al. (2006). The results of present investigation clearly indicated that sufficient variability for phenological traits is present in the material used. Since, mungbean is grown in arrays of eco-systems, hence early and/or late maturing genotypes can successfully be selected for using them in breeding programme. For instance, in Chhattisgarh little late maturity is desired for kharif but early maturity is desirable for rabi and summer seasons.
Plant height ranges from 35.27-72.92 with a mean performance of 46.56. Maximum plant height were recorded in genotypes BPMR 4 (72.92) followed by J 781 (72.28) and HUM 14 (64.35). However, minimum was recorded for BPMR 197 (35.27) followed by TM 80 (35.50) and OUM 41 (36.57). Plant height showed significant differences among the genotypes evaluated. Highest plant height was recorded in genotype BPMR 4 and the lowest in BPMR 197. Khairnar et al. (2003), Reddy et al. (2003) and Pandiyan et al. (2006) were also reported the variation in plant height in mungbean. Primary branches plant–1 ranged from 1.10-2.80 with mean performance of 1.51. The maximum number of primary branches plant–1 was recorded for ML 1278 (2.80) followed by RMG 34 (2.20) and MH 2-16 (2.10). However, genotype RMG-2 was recorded minimum (1.12) followed by Pusa 9531 (1.20) and ML 1194 (1.30). Significant variation was observed for primary branches. Maximum number of primary branches plant–1 was recorded in genotype ML 1278 and minimum in RMG-2. Variability for number of primary branches plant–1 was also reported by Reddy (1997), Raje and Rao (2000), Pandiyan et al. (2006) and Rao et al. (2006).
Number of primary branches is an important yield contributing traits, attempts to be done to develop a plant type with higher number of branches. The results obtained from the present investigation revealed that there is narrow variation for this trait. Most of the genotypes have primary branches on an average 1-2. However, three genotypes viz., ML 1278, RGM 34 and MH 2-16 had branches more than two. Hence, these parents are used in breeding programme for enriching higher branches in mungbean. Besides more genotypes to be tested for searching variability for higher number of primary branches.
Number of cluster plant–1 ranges from 3.03-8.40 cluster plant–1 with a mean performance of 5.43. Genotype KM 2241 possesses highest number of cluster plant–1 (8.40) followed by GM 9925 (7.95) and MH 2-16 (7.80), whereas, lowest number of clusters plant–1 were recorded for Pusa 9531 (3.03) followed by BPMR 37 (3.20) and MH 98-7 (3.45). Significant differences were observed for number of clusters plant–1 among genotypes tested. The highest number of clusters plant–1 was observed in genotype KM 2241 and the lowest in Pusa 9531. Variation in clusters plant–1 was reported by Reddy (1997), Raje and Rao (2000), Pandiyan et al. (2006) and Rao et al. (2006). Highest number of pods cluster–1 ranged from 2.10-4.80 with a mean performance of 3.05. Highest number of pods cluster–1 were recorded in genotype TM 2000-2 (4.80) followed by Malviya Jyoti (4.50) and RM 03-79 (4.20) whereas, lowest number of pods cluster–1 recorded in NVL 1 (2.10) followed by Pusa 0571 (2.22) and AKM 9910 (2.30). Highest numbers of pods cluster–1 were recorded in genotype TM 2000-2 and lowest for NVL 1. Variation in pods clusters–1 was reported by Reddy (1997), Pandiyan et al. (2006) and Rao et al. (2006).
Pod length ranged from 6.10-8.33 with a mean performance of 7.16. The maximum length of pods were recorded for IPM 03-3 (8.53) followed by TM 2000-2 (8.45) and RM 03-71 (8.34) whereas, minimum pod length was of genotype BPMR 206 (6.10) followed by Pragya (6.30) and IPM 03-3 (6.50). Significant differences were recorded for pod length. The IPM 03-3 showed maximum pod length, while genotype BPMR 206 showed minimum pod length. These results are in line with those of Bhadra et al. (1987), Khairnar et al. (2003) and Gul et al. (2007), who reported wide genetic variation for pod length among different mungbean lines. Number of seeds pod–1 ranged from 8.44-14.20 with a mean performance of 11.50. Maximum number of seeds pod–1 were recorded in genotype IPM 03-3 (14.20) followed by MH 3-18 (13.70) and MH 2-15 (13.60). Whereas, minimum seeds pod–1 were recorded for ML 1265 (8.44) followed by UPM 02-17 (9.20) and Pusa 0572 (9.60). Number of seeds pod–1 showed significant differences amongst the genotypes. The highest number of seeds pod–1 was recorded in genotype IPM 03-3, while the lowest for ML 1265. These results are supported by previous results as reported by Farrase (1995), Gul et al. (2007) and Rahim et al. (2010). Number of pods plant–1 ranged from 10.20-30.40 with a mean performance of 16.14. Highest pods plant–1 was recorded for genotype MGG-351 (30.40) followed by K-851 (26.20) and MH 2-16 (23.60). Whereas, lowest number of pods plant–1 were recorded in KG 5-83 (10.20) followed by OUM 41 (10.60) and NVL 1 (10.70). Analysis of data regarding number of pods plant–1 revealed significant differences among the tested genotypes. However, highest number of pods plant–1 was recorded in genotype MGG 351, while these were least in genotype KG 5-83. Venkateswarlu (2001), Reddy et al. (2003), Khairnar et al. (2003), Reddy et al. (2004) and Rahim et al. (2010) were also been reported the genetic variation for the trait studied.
Grain filling percentage was ranged from 75.00-99.00 with a mean performance of 91.32. Highest percentage of grain filling were recorded for ML 1286 (99.00) followed by J 781 (98.00) and MH 3-18 (97.00) whereas, lowest percentage of grain filling were observed for NVL 1 (75.00) followed by ML 1265 (81.00) and GM 9925 (82.70). Grain filling in percentage showed non significant differences among the tested genotypes and showed wide variation. The highest percentage of grain filling was recorded for ML 1286 and least for NVL 1. 100 seed weight ranged from 3.05-5.27 with a mean performance of 3.77. Genotype Pusa Vishal possessed highest 100 seed weight (5.27) followed by K 851 (4.91) and TM 2000-1 (4.55) whereas, lowest 100 seed weight were recorded for genotypes NVL 1 (3.05) followed by J 851 (3.22) and MH 2-16 (3.28). Test weight is an important yield contributing trait and decides the market premium too. Hence, emphasis should be given on bold seeds with green seed coat colour considering its market premium. Analysis of data revealed significant differences for 100 seed weight. The maximum 100 seed weight was obtained from genotype Pusa Vishal and minimum for NVL 1. These results are in accordance with those of Sharma (1995), Khairnar et al. (2003), Gul et al. (2007) and Rahim et al. (2010).
Hard seed in percentage ranged from 3.50-19.00 with a mean performance of 10.32. Maximum percentage of hard seed were found in genotypes RMG 2 (19.00) followed by Barabanki (16.50) and TARM-1 (15.00) whereas, lowest percentage of hard seed were recorded for J 781 (3.50) followed by PS 16 (7.20) and ML 1265 (7.30). Hard seed in percentage showed significant differences among the tested genotypes. The maximum percentage of hard seeds was found in genotype RMG-2 and minimum in J 781. These results are with the general agreement of Varma and Garg (2003). Hard seeds in pulse crops is an undesirable trait but due to physiological and differences in flowering and fruiting hard seeds developed particularly in pods developed on the top of the plant. Hence, plant breeders should see for lower percentage of hard seeds. Protein in percentage ranged from 19.20-26.00 with a mean performance of 22.43. Genotype TARM 1 had highest protein content (26.00) followed by TARM 18 (25.20) and TM 99-2 (25.10) whereas, lowest protein content was for OUM 41 (19.20) followed by BPMR 4 (19.80) and BPMR 197 (19.90). Protein percentage was also showed significant difference among the genotypes evaluated. The higher level of protein content in percent was obtained from TARM 1 and minimum from OUM 41. These results are in agreement with those of Bhadra et al. (1987).
Phenol content in mg g–1 ranged from 3.20-10.20 with a mean performance of 4.04. Highest phenol content was recorded in genotype TM 99-2 (10.20) followed by BPMR 37 (9.50) and TM 2000-2 (8.90) whereas, lowest were recorded for Pusa Vishal (3.20) followed by BM 2000-1 (3.33) and PS 16 (3.50). Phenol content in mg g–1 also showed significant differences among tested entries. Highest phenol content was recorded in genotype TM 99-2 and least for Pusa Vishal. These result are in general agreement with the findings of Parashar and Sindhan (1986) and Rathi et al. (1998). Phenolic compounds are considered important for controlling resistance to biotic stresses particularly diseases. The TM 99-2 having the highest phenol, also had resistant to powdery mildew disease.
Seed yield plant–1 ranged from 3.49-9.53 with a mean performance of 6.91. Maximum seed yield plant–1 were recorded for genotype IPM 03-3 (9.53) followed by MGG-351 (9.50) and K 851 (9.30) whereas, lowest yield were recorded for genotypes TM 2000-58 (3.50) followed by GM 9925 (3.70) and MH 2-37 (4.30). Analysis revealed significant differences in seed yield plant–1 among various genotypes. Maximum seed yield plant–1 was recorded in genotype MGG 351 and minimum in TM 2000-58. Genetic variation for grain yield has also been reported by Islam et al. (1999), Byregowda et al. (1997), Sinha et al. (1996), Reddy et al. (2003), Gul et al. (2007) and Rahim et al. (2010).
Estimates of genetic parameters of variability: The results obtained were further analyzed and total treatment variance was partitioned in genotypic coefficient of variation and phenotypic coefficient of variation. The same presented in Table 3.
Genotypic and phenotypic coefficient of variation: Coefficients of variation were estimated at phenotypic and genotypic levels. Phenotypic coefficients of variation were in general, higher in magnitude than that of genotypic coefficients for all the selected characters.
| Table 3: | Analysis of variance for yield and its components in mungbean |
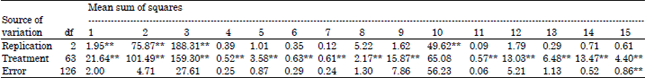 | |
**Significant at 1% probability, *Significant at 5% probability, 1: Days to 50% flowering, 2: Days to maturity, 3: Plant height (cm), 4: Number of primary branches plant–1, 5: Number of clusters plant–1, 6: No. of pods cluster–1, 7: Pod length (cm), 8: Number of seeds pod–1, 9: Number of pods plant–1, 10: Grain filling (%), 11: 100 seed weight (g), 12: Hard seed (%), 13: Protein content (mg g–1), 14: Phenol content (mg g–1) in seed and 15: Seed yield plant–1 | |
The highest values of coefficients of variation were recorded for seed yield plant–1 i.e., 28.34 and 24.13 followed by hard seed in percent 17.64 and 27.08, phenol content 16.78-18.93 and plant height 14.23 and 18.16 at genotypic and phenotypic levels, respectively. Coefficients of variation were estimated at phenotypic and genotypic levels. Phenotypic coefficients of variation in general, were higher than that of genotypic variation. Highest value of coefficient of variation was obtained for seed yield plant–1 followed by hard seed percentage, phenol content and plant height indicating the scope of selection for seed yield plant–1. The lowest amount of coefficient of variation was recorded for protein content followed by grain filling percent and pod length at both genotypic and phenotypic levels. There was much influence of environment on number of clusters plant–1, number of pods cluster–1, pods plant–1 and hard seed percent. Reddy (1997), Khairnar et al. (2003), Reddy et al. (2003), Pandiyan et al. (2006) and Rahim et al. (2010) also reported the similar results in his findings.
Heritability (%): Heritability estimates in broad sense was grouped as high (more 70 %), moderate (50-70%) and low (less 50%), as suggested by Burton (1952). Heritability in broad sense was calculated for each character. Seed yield plant–1 showed the highest (87.80) followed by days to maturity (87.30), number of pods plant–1 (77.40), days to 50% flowering (76.50), number of primary branches plant–1 (76.20) and 100 seed weight (74.30). Medium values of heritability were obtained for number of seeds pods–1 (68.10), number of pods plant–1 (65.30), pod length (63.90) and protein percentage (61.10), whereas, the lowest values of heritability were obtained for hard seed percent (33.40) followed by grain filling percentage (35.00), phenol content (49.20). Heritability measures the degree of resemblance between phenotypic and breeding value. Heritability is valid strictly for the population from which they are derived. The estimates for the same character may vary considerably for different populations. Differences in the estimates of heritability are mainly due to environmental variances. The environmental variance is dependent on the condition of genotype and management. Variable conditions reduces the heritability whereas, uniform conditions increases it.
The concept of heritability in broad sense is useful in knowing environment towards the phenotypic differences. The estimates of heritability have been broadly classified in to low (<50%), medium (50-70%) and high (>70%) as per classes suggested by Burton (1952).
Heritability in broad sense was calculated for all the fifteen traits. Seed yield plant–1 exhibited the highest heritability followed by days to maturity, number of pods cluster–1, Plant height, number of clusters plant–1, days to 50% flowering, number of primary branches plant–1 and 100 seed weight whereas, low heritability was observed for hard seed percent, grain filling percent and phenol content. It was moderate for number of pods plant–1, number of seeds pod–1 and pod length.
This indicates that these characters are highly heritable and governed by additive gene effects. Similarly, Natarajan et al. (1988), Reddy (1997), Raje and Rao (2000), Khairnar et al. (2003), Pandiyan et al. (2006), Rao et al. (2006) and Shrivastava and Singh (2012) had also reported high heritability for seed yield plant–1, primary branches plant–1 and number of clusters plant–1. For test weight high heritability was reported by Khairnar et al. (2003). The phenotypic values could give a fairly better idea about their genetic potential. Similar results were reported by Natarajan et al. (1988), Mishra et al. (1995), Tiwari et al. (1996), Ram (1997), Raje and Rao (2000), Gul et al. (2007), Venkateswarlu (2001), Reddy et al. (2003), Rehman et al. (2009), Pandiyan et al. (2006), Rao et al. (2006) and Rahim et al. (2010).
Genetic advance: The highest amount of genetic advance was observed for days to maturity (10.93) followed by plant height (10.69), number of pods plant–1 (9.69) and seed yield plant–1 (5.70), On the other hand, the lowest amount of genetic advance was recorded for number of pods cluster–1 (0.36), pod length (0.42), number of seeds plant–1 (0.47) and 100 seed weight (0.74) and grain filling percentage (0.79). Other characters have moderated value of genetic advance. The use of heritability estimates to predict genetic advance from selection for hypothetical testing programme appears to be advantageous. The heritability value alone, however, provides no indication of the amount of genetic improvement that would results from selecting the best individuals. Limitations of heritability in broad sense include both the additive and non additive gene effects, which become reliable if accompanied by high genetic advance (Ramanujan and Tirumalachar, 1967).
The highest genetic advance was obtained for days to maturity, plant height and number of pods plant–1, whereas, lowest was observed for number of pods cluster–1, pod length, number of seeds plant–1 and 100 seed weight. Similar results were reported by Natarajan et al. (1988), Mishra et al. (1995), Tiwari et al. (1996), Ram (1997), Sharma (1996), Raje and Rao (2000), Venkateswarlu (2001), Reddy et al. (2003), Rehman et al. (2009), Pandiyan et al. (2006), Rao et al. (2006), Gul et al. (2007) and Rahim et al. (2010).
Genetic advance as percentage of mean: Among all the characters seed yield plant–1 (82.60) followed by phenol content (79.70) had highest genetic advance as percentage of mean, whereas number of primary branches plant–1 (35.71), number of clusters plant–1 (25.50) and plant height (22.95) showed moderate genetic advance as percentage of mean. Grain filling percentage showed the lowest genetic advance as percentage of mean (0.86).
High heritability coupled with high genetic advance as percentage of means was observed for seed yield plant–1 (87.80, 82.60), number of primary branches plant–1 (76.20, 35.71), number of clusters plant–1 (70.70, 25.59) and plant height (71.40, 22.95).
High heritability with low genetic advance as percentage of mean was observed for number of pods cluster–1 (77.40, 11.80) followed by number of seeds pod–1 (68.10, 4.06), pod length (63.90, 5.86) and protein content (61.10, 9.58). Genetic advance, as percentage of mean was recorded for seed yield plant–1 and phenol content whereas, number of primary branches plant–1, number of clusters plant–1 and plant height showed moderate genetic advance as percentage of mean.
High heritability coupled with high genetic advance as percentage of mean was observed for seed yield plant–1, number of primary branches, number of clusters plant–1 and plant height. High heritability coupled with high genetic advance as percentage of mean was also observed by Ram (1997), Sharma et al. (1996), Reddy et al. (2003), Pandiyan et al. (2006) and Rao et al. (2006), number of primary branches were reported by Das and Chakraborty (1998) and Pandiyan et al. (2006) for number of primary branches. Ram (1997), Das and Chakraborty (1998) and Pandiyan et al. (2006) for number of clusters plant–1 and Reddy et al. (2003), Pandiyan et al. (2006), Rao et al. (2006), Rahim et al. (2010) and Shrivastava and Singh (2012). For plant height in mungbean. High heritability with low genetic advance as percentage of mean was observed for number of pods cluster–1, followed by number of seeds pod–1, pod length and protein content, which indicate the role of additive gene action in their expression. Rest of the characters had high to low heritability and low genetic advance as percentage of mean indicated the role of non additive genetic variance in their expression.
The estimates of broad sense heritability is use if interest is in phenotypic value only, it does not indicate the progress, which might be made through selection within a particular population. The presence of dominance and other types of epistasis might have played an important role in the inflated estimates of heritability. However, the prediction of genetic advance by using heritability estimates may strictly be applied in hypothetical testing programme for one generation selection. Similarly, heritability estimates were also valid for particular population from which the estimates are derived. However, heritability estimates observed in the study were compared with the previous workers results to get an overall picture for range of heritability estimates for seed yield and its components. Moreover, direct selection for the traits possessing additive genetic variance, which is fixable in nature, may lead to development of desirable mungbean plant.
The experimental findings of heritability and genetic advance estimates are in general agreement with that of several workers, who reported high to low estimates of heritability and genetic advance for various yield traits in mungbean similar results are reported by Natarajan et al. (1988), Malik and Singh (1991), Mishra et al. (1995), Tiwari et al. (1996), Ram (1997), Sharma (1996), Raje and Rao (2000), Venkateswarlu (2001), Reddy et al. (2003), Rohman et al. (2003), Pandiyan et al. (2006), Rao et al. (2006), Siddique et al. (2006), Rahim et al. (2010) and Shrivastava and Singh (2012).
CONCLUSION
Mungbean, is an important pulse crop, can be cultivated during kharif, rabi and summer seasons. In India, wide range of genotypic variability exist as its primary center of origin being under the Hindustan center of origin. Genetic enrichment of a crop either through direct improvement of a character in which plant breeder is interested or indirect improvement through component characters can be achieved effectively on the basis of sound genetic information. The ultimate goal of any breeding programme is yield enhancement and production of quality seed, can be achieved through existence and utilization of genetic variability for seed yield and its contributing characters and their association among themselves.
In any crop improvement programme association of high yielding varieties with qualitative traits is necessary. "Fitness for the purpose" is defined as quality and the attributes possessing it are known as quality attributes. In mungbean protein and phenol content are the quality traits, which increase the seed quality as well as provides resistance against various biotic stress.
REFERENCES
- Ghosh, A. and S. Panda, 2006. Association and variation studies between grain characteristics and germination of mungbean (Vigna radiata L. Wilczek). Legume Res., 29: 118-121.
Direct Link - Khairnar, M.N., J.V. Patil, R.B. Deshmukh and N.S. Kute, 2003. Genetic variability in mungbean. Legume Res., 26: 69-70.
Direct Link - Rahim, M.A., A.A. Mia, F. Mahmud, N. Zeba and K.S. Afrin, 2010. Genetic variability, character association and genetic divergence in mungbean (Vigna radiata L. Wilczek). Plant Omic J., 3: 1-6.
Direct Link - Ram, T., 1997. Gene action for certain quantitative characters in greengram (Vigna radiate (L.) Wilczek). Indian J. Genet. Plant Breed., 57: 143-148.
Direct Link - Raje, R.S. and S.K. Rao, 2000. Genetic parameters of variation for yield and its components in mungbean (Vigna radiata L. Wilczek) over environments. Legume Res., 23: 211-216.
Direct Link - Reddy, V.L.N., M. Reddisekhar, K.R. Reddy and K.H. Reddy, 2003. Genetic variability for yield and its components in mungbean (Vigna radiate (L.) Wilczek). Legume Res., 26: 300-302.
Direct Link - Siddique, M., M.F.A. Malik and S.I. Awan, 2006. Genetic divergence, association and performance evaluation of different genotypes of mungbean (Vigna radiata). Int. J. Agric. Biol., 8: 793-795.
Direct Link - Venkateswarlu, O., 2001. Genetic variability in greengram (Vigna radiata) (L.) Wilczek. Legume Res., 24: 69-70.
Direct Link - Rehman, A., S.K. Khalil, S. Nigar, S. Rehman and I. Haq et al., 2009. Phenology, plant height and yield of mungbean varieties in response to planting date. Sarhad J. Agric., 25: 147-151.
Direct Link - Rohman, M.M., A.S.M. Iqbal Hussain, M.S. Arifin, Z. Akhtar and M. Hasanuzzaman, 2003. Genetic variability, correlation and path analysis in mungbean. Asian J. Plant Sci., 2: 1209-1211.
CrossRefDirect Link