
Ayad Mohammed Fadhil Al-Quraishi
Faculty of Earth Resources, China University of Geosciences, Wuhan 430074, China
Journal of Applied Sciences
Year: 2003 | Volume: 3 | Issue: 10 | Page No.: 659-669


ABSTRACT
A soil erosion risk map was developed for Northwestern part of Hebei province, China, using the Revised Universal Soil Loss Equation (RUSLE). Remote Sensing (RS) and Geographical Information System (GIS) technology were used in this study. Spatially modeling soil erosion in the GIS required generating representative raster layers based on secondary data for the following parameters; rainfall erosivity, slope length/gradient, soil erodibility and conservation practices. Landsat TM imagery for the year 1996 was utilized to produce land use/cover maps of the study area based on the maximum likelihood classification method. These maps were then, used to generate the conservation practice factor in the RUSLE. The analysis was performed using IDRISI32, a raster based GIS software. Results showed that 3,413.51 km2 (54.968%) has very slight soil erosion and 1,761.98 km2 (28.373%) has slight soil erosion. This study demonstrates the effectiveness of RS and GIS in generating soil risk maps. The produced erosion risk map is a valuable resource for planners to minimize soil erosion problems caused by future and ongoing development projects on the study area and the other areas as well.
PDF Abstract XML References Citation
How to cite this article
Ayad Mohammed Fadhil Al-Quraishi, 2003. Soil Erosion Risk Prediction with RS and GIS for the Northwestern Part of Hebei Province, China. Journal of Applied Sciences, 3: 659-669.
DOI: 10.3923/jas.2003.659.669
URL: https://scialert.net/abstract/?doi=jas.2003.659.669
DOI: 10.3923/jas.2003.659.669
URL: https://scialert.net/abstract/?doi=jas.2003.659.669
INTRODUCTION
Desertification is one of the major environmental issues around the world. It is estimated that about one sixth of the world’s population and one quarter of the global terrestrial land is threatened by desertification (UNCED, 1994).
China suffers many kinds of soil erosion and desertification (Xianmo et al., 1999; Qinke, 1994). It is a developing country with the largest population in the world over 1.3 billion and it is also one of the countries affected most seriously by desertification. The affected area is about 3.317 million km2, accounting for 34.6%, approximately one third of the nation’s land area with around 400 million people being under the threat of desertification. Desertification is widely distributed in arid, semi-arid and dry sub-humid areas of the Northwest China, North China and the western part of Northeast China (CCICCD, 1996). Desertification caused by water erosion accounts for 47.9%, wind erosion for 43.6% and salinization for 8.5%. Another 4.7 million ha are potentially susceptible to desertification.
Soil erosion is a naturally occurring process on all land and it is a normal geologic process associated with the hydrologic cycle. The agents of soil erosion are Water and Wind, each contributing a significant amount of soil loss each year (Strahler, 1971). This research develops a soil erosion-predicting model based on the Universal Soil Loss Equation (USLE) and its subsequent Revised Universal Soil Loss Equation (RUSLE) in a geographic information systems (GIS) environment. The Universal Soil Loss Equation (USLE) developed by Wischmeier and Smith (1978) is the most frequently used empirical soil erosion model worldwide. More recently, Renard et al. (1997) has modified the USLE into a revised Universal Soil Loss Equation (RUSLE) by introducing improved means of computing the soil erosion factors. The RUSLE is written as:
A= R* K* LS* C* P
Where:
A, is the soil loss in t ha-1 over a period selected for R, usually a yearly basis; R is the rainfall-runoff erosivity factor in MJ mm/(ha h); K is the soil erodibility factor (t h/(MJ mm)); L is the slope length factor; S is the slope steepness factor; C is the cover and management factor; and P is the conservation practices factor. Within a raster-based IDRISI GIS, the RUSLE model can predict erosion potential on a cell-by-cell basis. This has distinct advantages when attempting to identify the spatial patterns of soil loss present within a large region. The GIS can then be used to isolate and query these locations to yield vital information about the role of individual variables in contributing to the observed erosion potential value. Application of the RUSLE within the Northwestern part of Hebei Province affords the following advantages: required data are readily available; it is fairly simple to apply; and it is compatible with a GIS.
The objective of the study is development of a soil erosion intensity map for the Northwestern part of Hebei province using RUSLE with the aid of GIS.
MATERIALS AND METHODS
Materials
The study area locates in the Northwestern part of Hebei province, China and covers 6,210 km2. It extends between latitude N 40° 33’ to N 41° 00’ and longitude E 114° 23’ to 116° 00’.
Hebei province is situated in temperate and warm temperate zones (36° 05’ to 42° 37’ north latitude and 113° 11’ to 119° 45’ east longitude). The climatic model of the province is continental monsoon climate. In the province, the four seasons is obvious, the annual precipitation is 340-800 mm and the raining season is in the summer. The total area of the province is 187,000 square kilometers. The total population of the province is 65,000,000. In the province, there are 11 administrative cities and 139 administrative counties. Geographically, the province can be divided into three regions, in the north is the south region of Mongolia plateau area and Yan mountain area, in the west is Taihang mountain area and the eastern and southeastern part belong to North China plain area.
In the past two decades many areas suffering from sand storms and drought in northern part of Hebei and areas suffering from soil erosion. Fig. 1 shows the location map of the study area.
METHODS
The overall methodology involved the use of the RUSLE in a GIS environment, with factors obtained from meteorological stations, soil surveys, topographic maps and Landsat TM imagery dataset for the year of 1996. Individual GIS files were built for each factor in the RUSLE and combined by cell-grid modeling procedures in IDRISI (Eastman, 1997) to predict soil loss in a spatial domain.
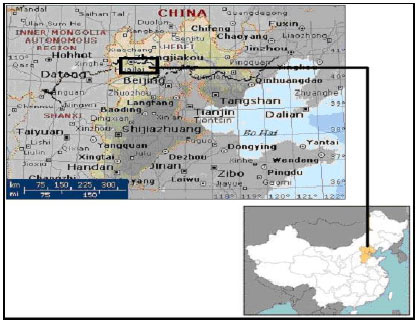 | |
| Fig. 1: | Location map of the study area |
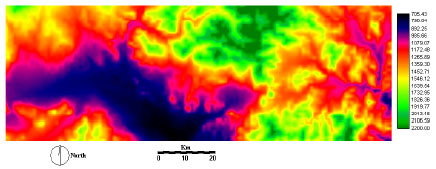 | |
| Fig. 2: | The DEM map for the study area |
Data sources
Digital elevation model (DEM)
In order to estimate the impact of slope length and slope steepness on the assessment of soil erosion risk in the Northwestern part of Hebei province at the study area in particular, the following procedure were adopted: Digital Elevation Model DEM map of the study area was created by digitizing the topographic map of Hebei province (scale 1:250,000). RUSLE-LS factor values were extracted from the DEM file of the study area by using USLE2D Ver. 4.1 software, Gover, 1991 algorithm to estimate LS values for the study area. Fig. 2 shows the DEM map of the study area.
Soil data
Soil data for this study is obtained from the Soil Survey Office of Hebei Province, SSOH (1990). The soil spatial data is digitized from the soil map of Hebei Province by using Arc/view GIS v3.2a and then soils attribute data were edited and added to the study database. The polygons and their attributes were connected with uniform code.
Precipitation data
Fourteen stations used in this study are randomly distributed within the study area. The monthly amounts of precipitation for these stations were collected over years 1987-1996. The monthly precipitation surface was interpolated from these 14-point observations in IDRISI by the command “INTERPOL”. INTERPOL determines the value of each cell based on the values of only near-by control points. “Near-by” is determined by setting a search radius that should lead, on average, to 6 control points being found. If less than 4 control points are found, the search radius is temporarily increased until a sufficient number are found. If more than 8 control points are found, the search radius is temporarily decreased until only 4-8 control points are found.
Land use/cover layer
A Landsat Thematic Mapper (TM) image with a spatial resolution of (30 m) for Northwestern part of Hebei province, China, for the year 1996 was used to produce a land use/cover map. The procedures adopted in our research are shown as following:
| • | Image-to-vector registration of the remote sensing data with a RMS error of 0.50 using the model of polynomial function and nearest neighbor re-sampling in datum WGS84 and projection UTM 50N. |
Landsat TM multispectral satellite imagery was classified using ERMapper ver. 6.1 packages and supervised classification method by applying maximum likelihood method. There were seven classes, which represented the most classes of land cover in the study area. Those classes were; water bodies, barren soils, farmlands, shrubs, forest, urban areas and weak vegetation.
| • | The classified land cover map was converted to the C factor layer in RUSLE (RUSLE_C factor) through reclassification of each land cover type into its corresponding C factor values, which estimated from RUSLE guide tables (Morgan, 1995; Wischmeier and Smith, 1978). Table 1 lists the C-factor values for the land use categories. These values were used to re-classify the land cover map to obtain the C-factor map of the study area. |
| Table 1: | C factor value for different classes |
 | |
Determining RUSLE factors values
Topographic factors (L and S)
The slope factors (LS) refer to topographic and/or relief factor. In the computation of the LS factors, the topographic factors, L and S factor are usually considered together. The slope length factor L, computes the effect of slope length on erosion and the slope steepness factor S and computes the effect of slope steepness on erosion.
Substituting the values for cell outlet and cell inlet into the Foster and Wischmeier (1974) equation solves the slope length L component:
 |
where L (I, j) is the slope length factor for the cell with coordinates (I, j) , A(i,j-out) is the contributing area at the outlet of the grid cell with coordinates (I, j), A(i,j-out) is the contributing area at the inlet of the grid cell with coordinates (I, j) and m is the slope length exponent of the USLE S-factor (Desmet and Govers, 1996).
To describe the influence of slope steepness, Liu et al. (1994) researched steep slopes data from China. Based on synthesizing the results presented by Liu et al. (1994) and Nearing (1997) produced a single continuous function for S:
 |
where: θ is the slope angle (degrees).
In order to utilize DEM calculating LS factor, a program USLE2D.EXE, which is designed to calculate the LS-factor in the USLE or RUSLE from a grid-based DEM and provided the user with a number of options in selecting the hydrological flow routing algorithm and the LS algorithm (Desmet and Govers, 2000) was used to compute LS factor.
Soil erodibility (K) factor
The K factor map was prepared from the soil map and its attribute data. The K values were usually estimated using the soil-erodibility nomograph method (Wischmeier et al., 1978). This method uses % silt plus very fine sand (0.002 mm-0.1 mm), % sand (0.1 mm-2 mm), % organic matter and soil structure and permeability classes to calculate K. However, there is lack of structure and permeability class data in the soil survey data sources. Therefore, we adapted following equation, which is recommended by RUSLE when lack observation data.
The soil erodibility factor was estimated using the equation of Renard et al. (1997) which is:
K=7.594 * {(0.0034+0.0405 * exp (-½(log (Dg)+1.659/0.7101) 2 ))}
Dg (mm) = exp 0.01* sum (fi-ln mi)
Where,
K, soil erodibility factor t.ha.h.ha-1.MJ-1.mm-1;
Dg, mean geometric particle diameter (mm);
fi, primary particle size fraction (%);
mi, arithmetic mean of the particle size limits of that size (mm).
Table 2 shows K values and particle sizes distribution and some chemical properties of the soil in the study area.
Rainfall erosivity (R) factor
The energy of a given storm depends upon all the intensities at which the rain occurred and the amount of precipitation that is associated with each particular intensity value. Within the RUSLE rainfall erosivity is estimated using the EI30 measurement (Renard et al., 1997). However, there is Lack of continuous pluviograph data. The R factor was determined by following relationship (Ma et al., 2002).
| Table 2: | K Values, soil particles size distribution, soil texture classes and some chemical properties for the soil in the Study area, Hebei Province, China |
 | |
| Table 3: | RUSLE-R factor values and P values in the study area and its Neighboring areas |
 | |
| Where, |
| Pi= month i average rainfall (mm); P= annual average rainfall (mm); Rann represents approximate annual average R rainfall erosivity factor value. Table 3 shows the R and P values for the study area. |
Conservation practice factor (P)
P is the conservation practice factor. The RUSLE_P factor reflects the impact of support practices in the average annual erosion rate. It is the ratio of soil loss with contouring and/or strip cropping to that with straight row farming up-and-down slope. As with the other factors, the P-factor differentiates between cropland and rangeland or permanent pasture. As the study of this research work to estimate soil erosion using RUSLE modeling was applied in the area of non-agriculture or on natural erosion, it was considered that there was no conservation practice (P) in non-agricultural areas. Therefore as the conservation practice factor (P) value ranges from 0.0-1.0 and the highest value is assigned to areas with no conservation practice, the maximum value for P that is 1.0 is assigned to this research work area.
Results and Discussion
Maps of R, K, LS, C and P factors were integrated within IDRISI to generate a composite map of erosion intensity. Fig. 3, 4, 5, 6 and 7 shows Soil Erodibilty Factor values map (RUSLE_K factor), Slope Length and Slope Steepness Factors (RUSLE_LS factor) map, RUSLE_C factor values map based on Landsat-5 TM image, respectively.
The layers of RUSLE model were created and integrated within IDRISI by an overlay procedure for the study area for the year 1996. Morgan (1995) argues that 10 t/(ha yr) is an appropriate boundary measure of soil loss over which agriculturists should be concerned. Assuming the worst-case scenario, i.e. having bare land with no conservation measures applied, the P values in the RUSLE were taken as 1.0.
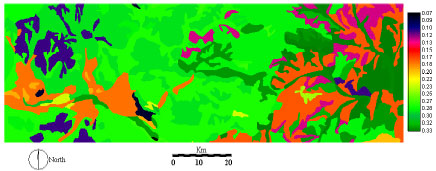 | |
| Fig. 3: | Soil Erodibilty Factor values (RUSLE_K factor) map for the study area |
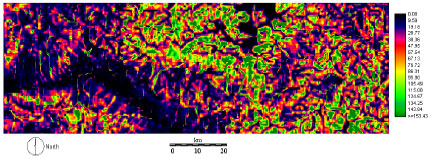 | |
| Fig. 4: | Slope Length and Slope Steepness Factors (RUSLE-LS factor) map for the study area |
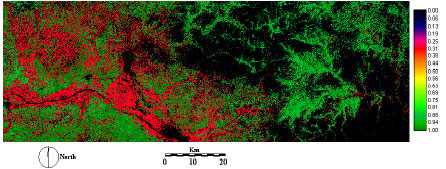 | |
| Fig. 5: | Land use/Cover (RUSLE_C factor) values map based on Landsat-5 TM image for the study area |
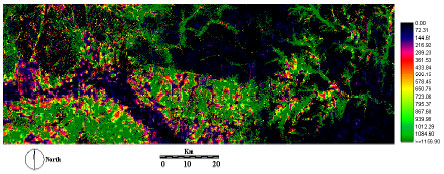 | |
| Fig. 6: | Soil erosion loss values map in the study area in the Northwestern part of Hebei province for the year 1996 |
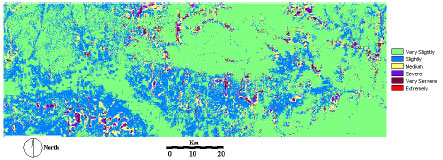 | |
| Fig. 7: | Soil erosion risk map in the study area in the Northwestern part of Hebei province for the year 1996 |
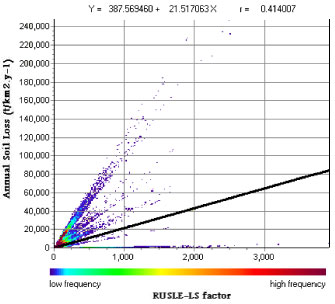 | |
| Fig. 8: | The relationship between the annual soil loss and RUSLE-LS factor in the Northwestern part of Hebei province for the year 1996 |
The quantitative output of predicted soil loss rates map (Fig. 6) for Northwestern part of Hebei province resulting from current data were then collapsed into six ordinal classes and displayed on the map in Fig. 7. Area and proportion were tabulated for each of the soil erosion potential categories (Table 4).
The results showed that there were statistical correlations among the RUSLE’s factors and the annual soil loss value for the years 1996. The strongest correlation was between the RUSLE_C factor and the annual soil loss (r=0.432) while it was (r=0.414) for the correlation between RUSLE_LS and annual soil loss value (Fig. 8). Table 5 shows that correlation and regressions relationships.
An erosion risk map for the Northwestern part of Hebei province was produced using RUSLE, Remote Sensing and GIS. The overall results were 54.968, 28.373, 8.286, 4.026, 3.045 and 1.301% for very slight, slight, medium, severe, very severe and Extremely Severe soil erosion risk classes, respectively.
| Table 4: | The ordinal categories of soil erosion and the area and proportion of each category |
 | |
| Table 5: | The correlations and regressions among the annual soil loss and RUSLE’s factors for the study area in the Northwestern part of Hebei province |
 | |
Major factors influencing soil erosion in the study area in the Northwestern part of Hebei province were the land use/cover RUSLE_C factor (r=0.432) and in the second order was the slope length (L) and slope steepness (S) RUSLE_LS factor (r= 0.414). This study demonstrates the effectiveness remote sensing and GIS in generating essential quantitative information on soil erosion. The outcome for this type of studies represents a valuable resource for decision makers to guard against land acquisition in high erosion risk areas or to issue conditional permits with conservation measures to future development projects. The result indicates that this method is rapid, objective, accurate, economical and able to provide scientific basis for policy decision.
Remote sensing and GIS can serve as valuable tools in assessing and monitoring the land degradation and soil erosion qualitatively and quantitatively as well, which will help in developing appropriate and timely conservation strategies. In general, it is clear from the results of this study that RUSLE is a powerful model for the qualitative as well as quantitative assessment of soil erosion intensity for the conservation management.
REFERENCES
- Renard, K.G., G.R. Foster, G.A. Weesies, D.K. McCool and D.C. Yoder, 1997. Predicting soil loss by water. A guide to Conservation planning with the revised universal Soil loss Equation (RUSLE). Number Agricultural Handbook number. United States Department of Agriculture (USDA), Washington, DC 20250, 703: 404.
- Wischmeier, W.H. and D.D. Smith, 1978. Predicting Rainfall Erosion Losses: A Guide to Conservation Planning. Department of Agriculture, Science and Education Administration, Washington, DC, USA, Pages: 58.
Direct Link - Mendonca, J.K.S. and R. Marcelo, 2002. Gully Erosion Monitoring in Sao Luis City-Maranhao State-Brazil. Soil and Fertilizer Society of Thailand. WCSS, Thailand.
Direct Link