
Hadi Tahmasbi Nejad
Faculty of Islamic Azad University, Behbahan Branch, Iran
Journal of Applied Sciences
Year: 2009 | Volume: 9 | Issue: 20 | Page No.: 3691-3698


ABSTRACT
In total 12 vertical electrical soundings, using Schlumberger configuration, were carried out in Behbahan Azad University Farm, South Western Iran, in order to investigate the aquifer characteristics and groundwater potential of the subsurface layers. The field data was interpreted using the Russian software IPI7.63. The depth and resistivity of the subsurface layers were determined. Also, the isoapparent resistivity maps, the geoelectrical psedosections, the geoelectric sections, the isothickness map of aquifer and the isotransverse resistance map of aquifer is drawn. The results of the interpretation of the VES data reveal the presence of the following geoelectric layers: (1) near-surface layers and dry alluvium with resistivity ranging from 1 to 15000 Ωm and thickness ranging from 16 to 23 m. (2) The second layer, which constitutes the aquifer of study area, has resistivity varying from 0.3 to 6.4 Ωm while the thickness varies from 6.9-10.7 m. It is composed of fine-grained sand. (3) The third layer, which constitutes Marly bedrock, characterized by electrical resistivity value varying from 6.8 to 37 Ωm in most parts of area and with depth ranges from 23.8 to 33 m. The resistivity value of this layer in two sounding is 120 and 131 Ωm. This is probably caused by existing Marly Limestone in these soundings. (4) The forth geoelectric layer, has resistivity values ranging from 0.4-4 Ωm. This layer corresponds probably to Shaly layer or confined aquifer. Also, the relationship between transverse resistance and aquifer transmissivity is used to determine zones with high yield potential and the best location for drilling wells in the area.
PDF Abstract XML References Citation
How to cite this article
Hadi Tahmasbi Nejad, 2009. Geoelectric Investigation of the Aquifer Characteristics and Groundwater Potential in Behbahan Azad University Farm, Khuzestan Province, Iran. Journal of Applied Sciences, 9: 3691-3698.
DOI: 10.3923/jas.2009.3691.3698
URL: https://scialert.net/abstract/?doi=jas.2009.3691.3698
DOI: 10.3923/jas.2009.3691.3698
URL: https://scialert.net/abstract/?doi=jas.2009.3691.3698
INTRODUCTION
Surface geophysical survey as a veritable tool in groundwater exploration, has the basic advantage of saving cost in borehole construction by locating target aquifer before drilling is embarked upon (Obiora and Ownuka, 2005).
Vertical Electrical Sounding (VES) is a geoelectrical common method to measure vertical alterations of electrical resistivity. This method has been recognized to be more suitable for hydrogeological survey of sedimentary basin (Kelly and Stanislav, 1993).
There are approximately one hundred independent geoelectric arrays (Szalai and Szarka, 2008) But, Schlumberger array is found to be more suitable and common in groundwater exploration. It is well known that resistivity methods can be successfully employed for ground water investigations, where a good electrical resistivity contrast exists between the water-bearing formation and the underlying rocks (Zohdy et al., 1974).
In general, VES method with Schlumberger array assumes considerable importance in the field of ground water exploration because of its ease of operation, low cost and its capability to distinguish between saturated and unsaturated layers. Thus this technique has been used in case study. This method is regularly used to solve a wide variety of groundwater problems. Such as determination of depth, thickness and boundary of a aquifer (Bello and Makinde, 2007; Omosuyi et al., 2007; Asfahani, 2006; Ismailmohamaden, 2005), determination of zones with high yield potential in an aquifer (Akaolisa, 2006; Oseji et al., 2005), determination of the boundary between saline and fresh water zones (El-Waheidi et al., 1992; Khalil, 2006), delineation seawater intrusion in coastal Aquifer (Sung-Ho et al., 2007; Benkabbour et al., 2004), delineation groundwater contamination (Park et al., 2007), determination of groundwater quality (Arshad et al., 2007), exploration of geothermal reservoirs (Cid-Fernández and Araujo, 2007; El-Qady, 2006), estimation of hydraulic conductivity of aquifer (Khalil and Monterio, 2009; Asfahani, 2007; Yadav, 1995), estimation of aquifer transmissivty (Yang and Lee, 2002) and estimation of aquifer specific yield (Onu, 2003).
The electrical resistivity technique enables the determination of subsurface resistivity by sending an electric current into the ground and measuring the potential field generated by the current. The depth of penetration is proportional to the Schlumberger array which uses closely spaced potential electrodes and widely spaced current electrodes.
The Schlumberger method have a greater penetration than the Wenner. In the resistivity method, the Wenner configuration discriminates between resistivities of different geoelectric lateral layers while the Schlumberger configuration is used for the depth sounding (Olowofela et al., 2005).
Separation between the electrodes in homogeneous ground and varying the electrodes separation provides information about the stratification of the ground (Dahlin, 2001). However, in general, the depth of infiltration is small in this method and only shallow subsurface layers have been surveyed (Danielsen et al., 2007).
For Schlumberger soundings, the apparent resistivity values (ρa) were plotted against half current electrode separation (AB/2) on a log-log graph and a smooth curve was drawn for each of the soundings. Then, the sounding curves were interpreted to determine the true resistivities and thicknesses of the subsurface layers.
MATERIALS AND METHODS
Description of the study area: The study area lies about 5 km East of Behbahan City in Khuzestan Province of Iran (Fig. 1). It covers an area of about 50 km2. From the climatic point of view, this area is semi desert and semidry.
Three wells exist in s tudy area according to area (50 km2), it needs drilling new wells, especially in the South East of the area. This study describes a geoelectric investigation undertaken in the case study. The main aim is to explore the groundwater potential of the area and specially delineation of areas suitable for water wells.
Geoelectrical setting: From the geoelectric point of view, the area belongs to the Zagross folded zone with Northwest-Southeast trends.
Stratum-rock units around the area, from old to new, include Gurpi Shaly formation, Pabdeh Shaly formation, Asemari Limestone formation, Mishan Marly formation, Gachsaran Chalky formation, Aghajari Alluvial formation and Bakhtiari Conglomerat formation.
Gurpi formation and Pabdeh formation make sinking points between the resistant formations such as Asemari formation, because the Shaly lithology has a little resistance against erosion. Asemari formation with karstic caving and abundant joints make heights in area.
The Gachsaran hilly formation that lies on Asemary is evaporative and non permeable. This formation makes the lowest points of the area because of little resistance against erosion factors. Running waters come bitter and saline because the Chalk and Slate caused this formation.
Geoelectrical resistivity survey: The resistivity survey in the study area was completed with 12 Schlumberger Electrical Soundings (VES), with a maximum current electrode spacing (AB) ranging from 600 to 1000 m.
Positions and extensions of all the VESs are indicated in Fig. 2.
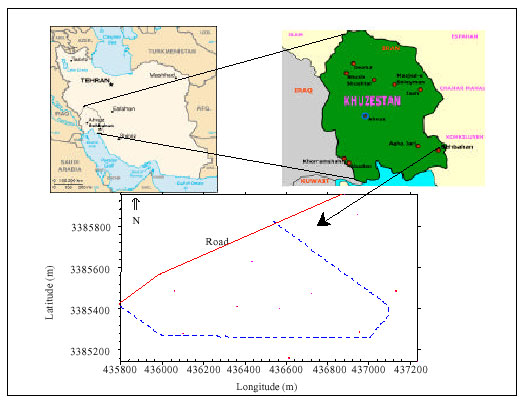 | |
| Fig. 1: | Location map of the study area |
 | |
| Fig. 2: | Distribution of all Vertical Electrical Soundings (VES) in the study area. Locations of wells with their water depths are also shown |
| Table1: | Sounding and profile with their coordinates |
 | |
These are arranged along the profiles 1 to 4, as shown in Table 1. The ABEM Terrameter SAS 1000 was utilized in data gathering. The field curves were interpreted by the well-known method of curves matching with the aid of Russian software IPI7.63. The key to success of any geophysical survey is the calibration of the geophysical data with hydrogeological and geological ground truth information.
Therefore, a number of geoelectric stations (VES B, H and K) were purposely located near dug wells so that lithologic information obtained from logs could be used to calibrate the VES field curves. Where test hole-log information was available, the solution to the automatic interpretation procedure was constrained by keeping known layer thickness constant during the program computations. Finallly, the results of the electrical soundings are in a good agreement with the geological sections.
RESULTS AND DISCUSSION
The field results obtained within the case study are presented in the form of qualitative interpretation (isoapparent electrical resistivity maps and geoelectrical pseudosections) and quantitative interpretation (Geoelectric psedosections).
 | |
| Fig. 3: | Isoapparent resistivity map for AB = 40 |
 | |
| Fig. 4: | Isoapparent resistivity map for AB = 80 |
It is hoped that the results of this study could also be used to determine the groundwater potentials of the study area.
Isoapparent resistivity maps: The isoapparent resistivity maps reflect the lateral variation of apparent resistivity over a horizontal plane at a certain depth. In other words, these maps indicate distribution of apparent resistivity in the area against distance of current electrodes.
A rule-of-thumb, the maximum exploration depth (also known as depth penetration) of the AMNB method is 1/3 to 1/4 of the maximum distance of AB (Frohlich et al., 1996).
Based on the depth of current penetration, the isoapparent resistivity map for AB = 40 correlate to depth of about 10meters and approximately reflects the surface layer in the total area (Fig. 3) and the isoapparent resistivity map for AB = 80 correlate to depth of about 20 m and reflects water-bearing layer in the total area (Fig. 4).
Overall, the apparent resistivity values in Fig. 3 are more than Fig. 4.
The cause of this difference is explainable as that current is conducted electrolytically by the interstitial fluids (in the saturated layers) and also surfacely by effective surface of minerals (in the dry layers) (Zohdy et al., 1974).
 | |
| Fig. 5: | Geoelectrical psedosections of profile 3 |
Thus, the high values of apparent resistivity observed at AB = 40 m are attributed to the presence of unconsolidated and dry layer at the depth of 10 m. The apparent resistivity contour with AB = 80 m show relatively less apparent resistivity because of the presence of zones saturated with water.
Furthermore, in the isoapparent resistivity map for AB = 80, the apparent resistivity values increase from south east to the North and East of the study area. Specially, in the center of aquifer (Sounding J) because of presence of the coarse sediments in the zones.
Geoelectrical psedosections: The geoelectrical psedosections indicate distribution of apparent resistivity of soundings of one profile in the various depths, for example, geoelectrical psedosections of profile 3 (including soundings J, I and H) are shown in Fig. 5.
The following results are obtained from comparison of psedosections of study area.
| • | In first view it is clear, that the apparent resistivity values decrease with increase in the depth of investigation. The causes of this area: Decrease of grain size with increase in the depth of investigation | |
| • | Existence of aquifer with low resistivity values | |
| • | Existence of a layer with very low resistivity values under the Marly bedrock | |
| • | In low depth of psedosections, almost all profiles indicate the lower apparent resistivity in the north of study area due to increasing grain size of surface layer in these zones | |
Interpretation of sounding curves: The interpretation of sounding curves in the study area shows the existence of the following geoelectric layers:
 | |
| Fig. 6: | The geoelectrical model of subsurface layers |
| • | Near-surface layers and dry alluvium with thickness ranging from 16 to 23 m and large variation in theirelectrical resistivity ranging from 1 to 15000 Ωm |
| • | The second geoelectric layer with thickness ranging from 6.9-10.7 m and resistivity values ranging between about 0.3 to 6.4 Ωm correspond to fine sandy aquifer. Resistivity of aquifer is controlled by the resistivity of pore fluid (water content and water quality) and the resistivity of grain matrix (shape, diameter and sorting of the grains, geometric packing arrangement and degree of matrix cementation). The effect of resistivity of pore fluid has more importance. But at small grain sizes and particularly when clay minerals are present, the electrical resistivity of the grain matrix cannot be ignored. For high-water resistivities and small-grain sizes, the electrical current is not only conducted by the pore fluid but also by the grain matrix (Frohlich and Parke, 1989) |
| • | The third geoelectric layer, with depth ranging from 23.8 to 33 m and resistivity ranging from 6.8 to 37 Ωm (depending upon the relative amount of fractures and infiltration of water) in most parts of area correspond to Marly bedrock. In soundings D and E, the resistivity value of this layer is 120 and 131 Ωm. This is probably caused by existing Marly Limestone |
| • | The forth geoelectric layer, has average depth of 63.4 and resistivity of less than 2 Ωm in most parts of the area corresponds probably to a Shaly layer or in all probability to a confined aquifer. However, even if this layer is a confined aquifer, drilling the bedrock is not economical due to the presence of clays and/or poor ground water quality. The geoelectrical model of subsurface layers indicates average of resistivity and thickness of layers is shown in Fig. 6 |
 | |
| Fig. 7: | The geoelectric section of profile 3 |
 | |
| Fig. 8: | Typical interpreted VES curve from study area (sounding J) |
For example, the geoelectric section of profile 3 is constructed according to the interpretation results of VES’s H, I and J is shown in Fig. 7.
Also, for example, interpreted curve of sounding J by software IPI7.63 is shown in Fig. 8.
In this sounding, the near-surface layer with thickness of 18.5 m consists of fine to coarse grain layers.
The next layer has thickness of about 9 m and resistivity of less than 1 Ωm.
This layer constitutes the aquifer. Resistivity of bedrock layer with thickness of about 35 m is about 7 Ωm.
 | |
| Fig. 9: | Depth, thickness and resistivity values of aquifer in the location of soundings |
The last and deepest layer with the resistivity of about 1.6 Ωm is in depth of about 63 m.
Depth thickness and the resistivity of aquifer is obtained from the interpretation of sounding curves.
 | |
| Fig. 10: | Isothickness map of aquifer |
 | |
| Fig. 11: | Depth and resistivity values of bedrock in the study area |
In Fig. 9 depth of aquifer is shown on the left side of soundings and thickness of aquifer is shown on the right ide of soundings and the resistivity of aquifer is shown on the top of soundings.
In the study area, depth of aquifer ranges from about 15.6 to 23 m. The minimum depth of aquifer is in the north-west part of the study area and the maximum depth of aquifer is in the north-east part of the study area. Figure 10 shows the isothickness map of aquifer.
The thickness of aquifer varies from 6.9 to 10.7 m and increases toward the center of aquifer (the site of VES.I). In Fig. 11 depth of bedrock is shown on the right side of soundings and the resistivity of bedrock is shown on the left side of soundings.
Transverse resistance map and determination of zones with high yield potential in the study area: Transmissivity as a hydraulic characteristic of aquifer is widely used for hydrogeologic investigation. This parameter is defined in the hydrogeology, as the product of its hydraulic conductivity for thickness of layer.
| (1) |
 | |
| Fig. 12: | Thickness value, resistivity value and transverse resistance of aquifer in the study area |
 | |
| Fig. 13: | Isotransverse resistance map of aquifer in the study area |
where, T is transmissivity, K is hydraulic conductivity and b is thickness of aquifer (Todd, 1980).
According to Maillet, 1947 transverse resistance (RT) as of the Darzarrouk parameters is defined as:
| (2) |
where, b and ρ are thickness and resistivity, respectively of the layer (Maillet, 1947). The relationship between transmissivity and transverse resistance is meaningful, simply because hydraulic conductivity and resistivity have a direct linear relationship (Niwas and Singhal, 1981). Combining two Eq. 1 and 2 gives:
| (3) |
This relationship is suitable for determination of aquifer transmissivity, as the ratio K/ρ is assumed to be constant in areas with similar geologic setting and water quality.
On a purely empirical basis, it can be admitted that the transmissivity of an aquifer is directly proportional to its transverse resistance (Henriet, 1975).
Therefore, transverse resistance maps is used in determination of zones with high groundwater potential (Toto et al., 2008; Braga et al., 2006) and suitable for drilling wells.
In Fig. 12 the values are shown on the right side, left side, up and down of soundings are respectively the resistivity of aquifer, the thickness of aquifer, soundings name and transverse resistance of aquifer. Also all the wells drilled in the area are indicated in this Fig. 12 isotransverse resistance map of aquifer is shown in Fig. 13.
According to Fig. 12 and 13 the transverse resistance value of soundings of L, J and I is the lower than 10 Ωm2 and so, the yield potential in this point is low. Also, the best location for well drilling in this area, is suggested in location of sounding E.
Because of high thickness value, high resistivity value, high transverse resistance value and lack of well in near its.
CONCLUSION
The geoelectric investigations showed that there are four geoelectric layers with electrical resistivity, from top to bottom, between 1-15000, 0.3-6.4, 6.8-37 Ωm (except the sounding S, D and E) and 0.4-4 Ωm.
These layers correspond to near-surface layers and dry alluvium, fine sandy aquifer, Marly bedrock and Shaly layer or confined aquifer, respectively.
The depth values and the isothickness map of aquifer reveals that aquifer thickness varies from 15.6 to 23 m. Also, bedrock depth lies between 23.8 and 33 m.
The isotransverse resistance value of soundings of L, J and I is the lower than 10 Ωm2. Considering the relationship between transverse resistance and aquifer transmissivity, the yield potential in these points is low.
Considering to high thickness value, high resistivity value, high transverse resistance value and lack of well, the best location for well drilling in this area, is suggested to be in location of sounding E.
REFERENCES
- Akaolisa, C., 2006. Aquifer transmissivity and basement structure determination using resistivity sounding at Jos Plateau state Nigeria. Environ. Monitor. Assess., 114: 27-34.
CrossRefDirect Link - Arshad. M., J.M. Cheema and S. Ahmed, 2007. Determination of lithology and groundwater quality using electrical resistivity survey. Int. J. Agric. Biol., 9: 143-146.
Direct Link - Asfahani, J., 2006. Geoelectrical investigation for characterizing the hydrogeological conditions in semi-arid region in Khanasser valley, Syria. J. Arid Environ., 68: 31-52.
CrossRefDirect Link - Bello, A.A. and V. Makinde, 2007. Delineation of the aquifer in the South-Western part of the Nupe Basin, Kwara State, Nigeria. J. Am. Sci., 3: 36-44.
Direct Link - Benkabbour, B., E.A. Toto and Y. Fakir, 2004. Using DC resistivity method to characterize the geometry and the salinity of the Plioquaternary consolidated coastal aquifer of the Mamora plain, Morocco. Environ. Geol., 45: 518-526.
CrossRefDirect Link - Dahlin, T., 2001. The development of DC resistivity imaging techniques. Comput. Geosci., 27: 1019-1029.
CrossRefDirect Link - Danielsen, J., T. Dahlin, R. Owen, P. Mangeya and E. Auken, 2007. Geophysical and hydrogeologic investigation of groundwater in the Karoo stratigraphic sequence at Sawmills in Northern Matabeleland, Zimbabwe: A case history. Hydrogeol. J., 15: 945-960.
CrossRefDirect Link - El-Qady, G., 2006. Exploration of a geothermal reservoir using geoelectrical resistivity inversion: Case study at Hammam Mousa, Sinai, Egypt. J. Geophys. Eng., 3: 114-121.
CrossRefDirect Link - Frohlich, R.K., J.J. Fisher and E. Summerly, 1996. Electric-hydraulic conductivity correlation in fractured crystalline bedrock: Central Landfill, Rhode Island, USA. J. Applied Geophys., 35: 249-259.
Direct Link - Khalil, M.H., 2006. Geoelectric resistivity sounding for delineating salt water intrusion in the Abu Zenima Area, West Sinai, Egypt. J. Geophys. Eng., 3: 243-251.
CrossRefDirect Link - Khalil, M.A. and F.A.S. Monterio, 2009. Influence of degree of saturation in the electric resistivity-hydraulic conductivity relationship. Surv. Geophys.
CrossRefDirect Link - Maillet, R., 1947. The fundamental equations of electrical prospecting. Geophysics, 12: 529-556.
CrossRefDirect Link - Niwas, S. and D.C. Singhal, 1981. Estimation of aquifer transmissivity from Dar-Zarrouk parameters in porous media. J. Hydrol., 50: 393-399.
CrossRefDirect Link - Braga, A.C.O., W.M. Filho and J.C. Dourado, 2006. Resistivity (DC) method applied to a aquifer protection studies. Revista Brasileira Geofısica, 24: 573-581.
Direct Link - Olowofela, J.A., V.O. Jolaosho and B.S. Badmus, 2005. Measuring the electrical resistivity of the earth using a fabricated resistivity meter. Eur. J. Phys., 26: 501-515.
CrossRefDirect Link - Omosuyi, G.O., A. Adeyemo and A.O. Adegoke, 2007. Investigation of groundwater prospect using electromagnetic and geoelectric sounding at afunbiowo, near Akure, Southwestern Nigeria. Pacific J. Sci. Technol., 8: 172-182.
Direct Link - Oseji, J.O., E.A. Atakpo and E.C. Okolie, 2005. Geoelectric investigation of the aquifer characteristics and groundwater potential in Kwale, Delta state, Nigeria. J. Applied Sci. Environ. Manage., 9: 157-160.
Direct Link - Park, Y.H., S.J. Doh and S.T. Yun, 2007. Geoelectric resistivity sounding of riverside alluvial aquifer in an agricultural area at Buyeo, Geum River watershed, Korea: An application to groundwater contamination study. Environ. Geol., 53: 849-859.
CrossRefDirect Link - Song, S.H., J.Y. Lee and N. Park, 2007. Use of vertical electrical soundings to delineate seawater intrusion in a coastal area of Byunsan, Korea. Environ. Geol., 52: 1207-1219.
Direct Link - Szalai, S. and L. Szarka, 2008. On the classification of surface geoelectric arrays. Geophys. Prospect., 56: 159-175.
Direct Link - Toto, E.A., C. Kerrouri, I. Zouhri, M. El Basri, A. Ibenbrahim, H. Mohamad and B. Benammi, 2008. Geoelectrical exploration for groundwater in Al Maha Forest, Ain Jouhra, Morocco. Hydrol. Processes, 22: 1675-1686.
Direct Link - Yadav, G.S., 1995. Relating hydraulic and geoelectric parameters of the Jayant aquifer, India. J. Hydrol., 167: 23-38.
CrossRefDirect Link - Yang C. and V. Lee, 2002. Using direct current resistivity sounding and geostatistics to aid in hydrogeological studies in the Choshuichi Alluvial Fan, Taiwan. Ground Water, 40: 165-173.
PubMedDirect Link - Henriet, J.P., 1976. Direct applications of the dar zarrouk parameters in ground water surveys. Geophys. Prospect., 24: 344-353.
CrossRef