
Esref Isik
Department of Agricultural Machinery, Faculty of Agriculture, Uludag University, Bursa,16059, Turkey
Pakistan Journal of Biological Sciences
Year: 2007 | Volume: 10 | Issue: 3 | Page No.: 474-480


ABSTRACT
This study was conducted to investigate some moisture dependent physical and mechanical properties of green laird lentil grains namely, grain dimensions, thousand grain mass, surface area, projected area, sphericity, bulk density, true density, porosity, terminal velocity, static coefficient of friction against different materials. The average diameter and thickness were 6.72 and 2.58 mm, at a moisture content of 11.36% d.b., respectively. In the above moisture range, the arithmetic and geometric mean diameters increased from 5.340 to 5.685 mm and from 4.879 to 5.260 mm, respectively, while the sphericity decreased from 0.727 to 0.744. In the moisture range from 11.36-25.08% d.b., studies on rewetted green laird lentil grains showed that the thousand grain mass increased from 72.00 to 73.90 g, the projected area from 36.98 to 55.60 mm2, the true density from 1170 to 1420 kg m-3, the porosity from 29.91 to 55.63% and the terminal velocity from 5.90 to 7.10 m s-1. The bulk density decreased from 820 to 630 kg m-3 with an increase in the moisture content range of 11.36-25.08% d.b. The static coefficient of friction of green laird lentil grains increased against surfaces of six structural materials, namely, rubber (0.51-0.58), aluminum (0.48-0.57), stainless steel (0.38-0.44), galvanized iron (0.42-0.50), glass (0.35-0.40) and MDF (medium density fiberboard) (0.31-0.36) as the moisture content increased from 11.36-25.08% d.b.
PDF Abstract XML References Citation
How to cite this article
Esref Isik, 2007. Moisture Dependent Physical and Mechanical Properties of Green Laird Lentil (Lens culinaris) grains. Pakistan Journal of Biological Sciences, 10: 474-480.
DOI: 10.3923/pjbs.2007.474.480
URL: https://scialert.net/abstract/?doi=pjbs.2007.474.480
DOI: 10.3923/pjbs.2007.474.480
URL: https://scialert.net/abstract/?doi=pjbs.2007.474.480
INTRODUCTION
Food crops of physical and mechanical properties gain importance during harvesting with machines, separation and cleaning processes of this crop and also during the designation or improvement of this type of machines. Physical properties consist of dimensional properties such as crop width, length, thickness and technical properties such as specific gravity; bulk density and thousand grain weights. However, mechanical properties are the behavior of the crops against to applied force (Isik and Güler, 2004).
A green laird lentil grain is a cultivated plant grown for dry consumption and raw material of canned food industry. It contains 26.64% protein, 54.97% carbohydrates, 1.43% fat, 49.11% starch per 100 g (dry) and 197 mg calcium, 53.2 mg sodium, 53.0 mg iron per kilograms.
Turkey had about 60,000 ha of green laird lentils harvesting area, 60,000 t of green laird lentils production per annum with a yield of 1000 kg ha-1 of green laird lentils in 20004 (SIS, 2006).
This study was conducted to investigate some moisture dependent physical and mechanical properties of green laird lentil grains namely, grain dimensions, thousand grain mass, surface area, projected area, sphericity, bulk density, true density, porosity, terminal velocity, static coefficient of friction against different materials.
MATERIALS AND METHODS
The green laird lentil grains used in the study were obtained from a local market (Marmara region, Bursa, Turkey). The grains were cleaned manually to remove all foreign matter such as dust, dirt, stones and chaff as well as immature, broken grains. The initial moisture content of the grains was determined by digital moisture meter (Pfeuffer HE 50, Germany) reading to 0.01%.
The samples of the desired moisture contents were prepared by adding the amount of distilled water as calculated from the following relation (Ünal et al., 2006):
(1) |
The samples were then poured into separate polyethylene bags and the bags sealed tightly. The samples were kept at 5°C in a refrigerator for a week to enable the moisture to distribute uniformly throughout the sample. Before starting a test, the required quantity of thegrain was taken out of the refrigerator and allowed to equilibrate to the room temperature for about 2 h (Singh and Goswami, 1996).
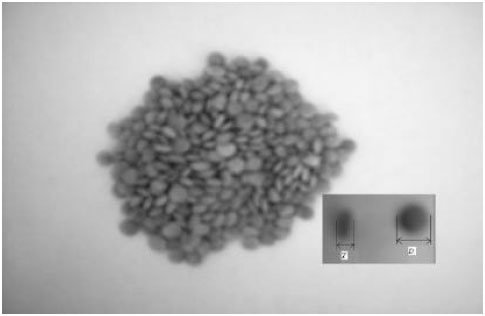 | |
| Fig. 1: | General appearance of green laird lentil grains |
All the physical properties of the grains were determined at six moisture contents in the range of 11.36%-25.08% d.b. To determine the average size of the grain, their two linear dimensions namely, diameter (D) and thickness (T) (Fig. 1) were measured using a digital compass (Minolta, Japan) with a accuracy of 0.01 mm.
The average diameter of grain was calculated by using the arithmetic mean and geometric mean of the two axial dimensions. The arithmetic mean diameter Da and geometric mean diameter Dg of the grain were calculated by using the following relationships.
(2) |
(3) |
The sphericity of grains Φ was calculated by using the following relationship :
(4) |
The one thousand grain mass was determined by means of an electronic balance reading to 0.001 g.
The surface area As in mm2 of green laird lentil grains were found by analogy with a sphere of same geometric mean diameter, using the following relationship (Olajide and Ade-Omewaye, 1999; Tunde-Akintunde and Akintunde, 2004).
(5) |
The projected area Ap was determined from the pictures of green laird lentil grains which were taken by a digital camera (Creative DV CAM 316; 6.6 Mpixels), in comparison with the reference area to the sample area by using the Global Lab Image 2-Streamline (trial version) program (Isik and Güler, 2003).
The average bulk density of the green laird lentil grains was determined using the standard test weight procedure reported by Singh and Goswami (1996) and Gupta and Das (1997) by filling a container of 500 mL with the grain from a height of 150 mm at a constant rate and then weighing the content.
The average true density was determined using the toluene displacement method. The volume of toluene (C7H8) displaced was found by immersing a weighed quantity of green laird lentil grains in the toluene (Singh and Goswami, 1996). The porosity was calculated from the following relationship (Mohsenin, 1970):
(6) |
The terminal velocities of grain at different moisture contents were measured using a cylindrical air column in which the material was suspended in the air stream (Nimkar and Chattopadhyay, 2001). The air column was 28 mm in diameter. Relative opening of a regulating valve provided at blower output end was used to control the airflow rate. In the beginning, the blower output was set at minimum. For each experiment, a sample was dropped into the air stream from the top of the air column. Then airflow rate was gradually increased till the grain mass gets suspended in the air stream. The air velocity which kept the grain suspension was recorded by a digital anemometer (Thies clima, Germany) having a least count of 0.1 m sec-1 (Özdemir and Akinci, 2004).
The static coefficient of friction of green laird lentil grains against six different structural materials, namely rubber, galvanized iron, aluminum, stainless steel, glass and MDF was determined. A polyvinylchloride cylindrical pipe of 50 mm diameter and 100 mm height was placed on an adjustable tilting plate, faced with the test surface and filled with the grain sample. The cylinder was raised slightly so as not to touch the surface. The structural surface with the cylinder resting on it was raised gradually with a screw device until the cylinder just started to slide down and the angle of tilt was read from a graduated scale (Yalcin and Özarslan, 2004). The coefficient of friction was calculated from the following relationship:
(7) |
where μ is the coefficient of friction and α is the angle of tilt in degrees.
Statistical design: The average size of the grain, 100 grains were randomly chosen and the other physical and mechanical properties of the grains were determined at six moisture (from 11.36 to 25.08% d.b.) content with 10 replications at each moisture content level and the results obtained were subjected to analysis of variance (ANOVA) using SPSS 14.0 software and analysis of regression using Microsoft Excel.
RESULTS AND DISCUSSION
Grain dimensions: The mean dimensions of 100 grains measured at a moisture content of 11.36% d.b. are: diameter 6.72±0.042 mm and thickness 2.58±0.016 mm (Fig. 2).
The average diameters increased with the increase in moisture content as axial dimensions. The arithmetic and geometric mean diameter ranged from 5.340 to 5.685 mm and 4.879 to 5.260 mm as the moisture content increased from 11.36-25.08% d.b, respectively (Fig. 2).
One thousand grain mass: The one thousand green laird lentil grains mass M1000 increased linearly from 72.00 to 73.90 g as the moisture content increased from 11.36-25.08% d.b. (Fig. 3). An increase of 2.63% in the one thousand grain mass was recorded within the above moisture range. The linear equation for one thousand grain mass can be formulated to be:
(8) |
A linear increase in the one thousand green laird lentil grains mass as the grain moisture content increases has been noted by Desphande et al. (1993) for soybean, Sacilik et al. (2003) for hemp.
Surface area of grain: The Fig. 4 indicates that the surface area increases linearly with increase in grain moisture content. The surface area of green laird lentil grains increased from 74.942 to 87.036 mm2 when the moisture content increased from 11.36-25.08% d.b.
 | |
| Fig. 2: | Dimensions of green laird lentil grains (Values in the same columns followed by different letter(s) are significant, P<0.05) |
 | |
| Fig. 3: | Effect of moisture content one thousand grains mass of green laird lentil grains (Values followed by different letters are significant, p<0.05) |
 | |
| Fig. 4: | Effect of moisture content on surface area of green laird lentil grains (Values followed by different letters are significant, p<0.05) |
The variation of moisture content and surface area can be expressed mathematically as follows:
(9) |
with a value for the coefficient of determination R2 of 0.9406.
Same trends have been reported by Dursun and Dursun (2005) for caper seed.
Projected area of grain: The projected area of green laird lentil grains increased from 36.98 to 55.60 mm2, when the moisture content of grain increased from 11.36-25.08% d.b. (Fig. 5). The variation in projected area with moisture content of green laird lentil grains can be represented by the following equation:
(10) |
However, different increasing trends have been reported by Ögüt (1998) for white lupine, Özarslan (2002) for cotton and Konak et al. (2002) for chick pea grain and for Turkish mahaleb.
 | |
| Fig. 5: | Effect of moisture content on projected area of green laird lentil grains (Values followed by different letters are significant, p<0.05) |
 | |
| Fig. 6: | Effect of moisture content on sphericity of green laird lentil grains (Values followed by different letters are significant, p<0.05) |
Sphericity: The sphericity of green laird lentil grains increased from 0.727 to 0.7446 with the increase in moisture content (Fig. 6). The relationship between sphericity and moisture content Mc in%d.b. can be represented by the following equation:
(11) |
Similar trends have been reported by Aydin et al. (2002) for Turkish Mahaleb, Baryeh and Mangope (2003) for pigeon pea, Sahoo and Srivastava (2002) for okra grain and Sacilik et al. (2003) for hemp grain.
Bulk density: The values of the bulk density for different moisture levels varied from 820 to 630 kg m-3 (Fig. 7).
 | |
| Fig. 7: | Effect of moisture content on bulk density of green laird lentil grains (ns: not significant) |
 | |
| Fig. 8: | Effect of moisture content on true density of green laird lentil grains (ns: not significant) |
The bulk density of grain was found to bear the following relationship with moisture content:
(12) |
with a value for R2 of 0.9655.
A similar decreasing trend in bulk density has been reported by Gupta and Das (1997) for sunflower grain, Coskun et al. (2006) for sweet corn seed.
True density: The true density varied from 1170 to 1420 kg m-<3 when the moisture level increased from 11.36-25.08% d.b. (Fig. 8). The true density and the moisture content of grain can be correlated as follows:
(13) |
with a value for R2 of 0.9677.
 | |
| Fig. 9: | Effect of moisture content on porosity of green laird lentil grains (Values followed by different letters are significant, p<0.05) |
 | |
| Fig. 10: | Effect of moisture content on terminal velocity of green laird lentil grains (Values followed by different letters are significant, p<0.05) |
The results were similar to those reported by Singh and Goswami (1996) for cumin grain, Yalcin and Ozarslan (2004) for vetch seed.
Porosity: The porosity of green laird lentil grains increased from 29.91 to 55.63% with the increase in moisture content from 11.36-25.08% d.b. (Fig. 9). The relationship between porosity and moisture content can be represented by the following equation:
(14) |
with a value for R2 of 0.9604.
Gupta and Das (1997), Ögüt (1998), Nimkar and Chattopadhyay (2001), Konak et al. (2002), Nimkar et al. (2005), Aviara et al. (2005), Çalisir et al. (2005) and Coskun et al. (2006) reported similar trends in the case of sunflower grain, white lupine, green gram, chick pea, moth gram, Balanites aegyptiaca nuts, okra seed and sweet corn seed, respectively.
Terminal velocity: The experimental results for the terminal velocity of green laird lentil grains at various moisture levels are shown in Fig. 10. The terminal velocity was found to increase logarithmic from 5.90 to 7.10 m s-1 as the moisture content increased from 11.36-25.08% d.b. The relationship between terminal velocity and moisture content can be represented by the following equation:
(15) |
However, linear trends were reported by Joshi et al. (1993), Suthar and Das (1996), Gupta and Das (1997) and in the case of pumpkin grains, sunflower, karingda, respectively.
Static coefficient of friction: The static coefficient of friction of green laird lentil grains on six surfaces (rubber, stainless steel, aluminum, glass, MDF and galvanized iron) against moisture content in the range 11.36-25.08% d.b. are presented in Fig 11. It was observed that the static coefficient of friction increased with increase in moisture content for all the surfaces. This is due to the increased adhesion between the grain and the material surfaces at higher moisture values. Increases of 13.72, 15.78, 18.75, 14.28, 16.12 and 19.04% were recorded in the case of rubber, stainless steel, aluminum, glass, MDF and galvanized iron, respectively, as the moisture content increased from 11.36-25.08% d.b. At all moisture contents, the least static coefficient of friction were on MDF. The relationships between static coefficients of friction and moisture content on rubber (μrub), stainless steel (μss), aluminum (μal), glass (μgl), MDF (μmdf) and galvanized iron (μgi) can be represented by the following equations:
(16) |
| (17) |
(18) |
(19) |
(20) |
(21) |
Similar results without galvanized iron were found by Singh and Goswami (1996), Chandrasekar andViswanathan (1999), Nimkar and Chattopadhyay (2001), Sahoo and Srivastava (2002), Yalcin and Ozarslan (2004), Dursun and Dursun (2005), Nimkar et al. (2005), Coskun et al. (2006) and for cumin, coffee, green gram seeds, okra, vetch, caper, moth gram and sweet corn, respectively.
 | |
| Fig. 11: | Effect of moisture content on static coefficient of friction of green laird lentil grains against various surface: (□) rubber; (x) galvanized iron; (Δ) aluminum; (◊) stainless steel; (o) glass; (*) MDF |
ACKNOWLEDGMENT
This study was supported by the Research Fund of The University of Uludag and DPT Project number: Z-004/49 and Z-2005/3.
NOMENCLATURE
| Ap | projected area, mm2 |
| As | surface area, mm2 |
| Da | arithmetic mean diameter of grain, mm |
| Dg | geometric mean diameter of grain, mm |
| D | diameter of grain, mm |
| M100 | thousand grain mass, g |
| Mi | initial moisture content of sample,%d.b. |
| Mf | final moisture content of sample,%d.b. |
| Mc | moisture content,%d.b. |
| Pf | porosity, % |
| Rs | shelling resistance, N |
| R2 | coefficient of determination |
| Q | mass of water to added, kg |
| T | thickness of grain, mm |
| Vt | terminal velocity, m s-<1 |
| Wi | initial mass of sample, kg |
| α | Angle of tilt, degree |
| μ | Static coefficient of friction |
| ρb | bulk density, kg m-<3 |
| ρt | true density, kg m-<3 |
| Φ | sphericity of grain |
Subscripts
| al | aluminum |
| gi | galvanized iron |
| gl | glass |
| MDF | medium density fibreboard |
| ru | rubber |
| ss | stainless steel |
REFERENCES
- Aviara, N.A., E. Mamman and B. Umar, 2005. Some physical properties of Balanites aegyptiaca nuts. Biosyst. Eng., 92: 325-334.
Direct Link - Baryeh, E.A. and B.K. Mangope, 2003. Some physical properties of QP-38 variety pigeon pea. J. Food Eng., 56: 59-65.
CrossRefDirect Link - Calisir, S., M. Ozcan, H. Haciseferogullari and M.U. Yildiz, 2005. A study on some physico-chemical properties of Turkey okra (Hibiscus esculenta L.) seeds. J. Food Eng., 68: 73-78.
CrossRefDirect Link - Chandrasekar, V. and R. Viswanathan, 1999. Physical and thermal properties of coffee. J. Agric. Eng. Res., 73: 227-234.
Direct Link - Coskun, M.B., I. Yalcin and C. Ozarslan, 2006. Physical properties of sweet corn seed (Zea mays saccharata Sturt.). J. Food Eng., 74: 523-528.
Direct Link - Desphande, S.D., S. Bal and T.P. Ojha, 1993. Physical properties of soybean. J. Agric. Eng. Res., 56: 89-98.
Direct Link - Dursun, E. and I. Dursun, 2005. Some physical properties of caper seed. Biosyst. Eng., 92: 237-245.
CrossRefDirect Link - Gupta, R.K. and S.K. Das, 1997. Physical properties of sunflower seeds. J. Agric. Eng. Res., 66: 1-8.
CrossRefDirect Link - Joshi, D.C., S.K. Das and R.K. Mukherjee, 1993. Physical properties of pumpkin grains. J. Agric. Eng. Res., 54: 219-229.
Direct Link - Konak, M., K. Carman and C. Aydin, 2002. Physical properties of chick pea grains. Biosyst. Eng., 82: 73-78.
Direct Link - Nimkar, P.M. and P.K. Chattopadhyay, 2001. PH-postharvest technology: Some physical properties of green gram. J. Agric. Eng. Res., 80: 183-189.
CrossRefDirect Link - Nimkar, P.M., D.S. Mandwe and R.M. Dudhe, 2005. Physical properties of moth gram. Biosyst. Eng., 91: 183-189.
CrossRefDirect Link - Ogut, H., 1998. Some physical properties of white lupin. J. Agric. Eng. Res., 69: 273-277.
CrossRefDirect Link - Ozarslan, C., 2002. PH-Post harvest technology: Physical properties of cotton seeds. Biosyst. Eng., 83: 169-174.
CrossRef - Ozdemir, F. and I. Akinci, 2004. Physical and nutritional properties of four major commercial Turkish hazelnut varieties. J. Food Eng., 63: 341-347.
Direct Link - Sacilik, K., R. Ozturk and R. Keskin, 2003. Some physical properties of hemp seed. Biosyst. Eng., 86: 191-198.
CrossRefDirect Link - Sahoo, P.K. and A.P. Srivastava, 2002. PH-postharvest technology: Physical properties of okra seed. Biosyst. Eng., 83: 441-448.
CrossRefDirect Link - Singh, K.K. and T.K. Goswami, 1996. Physical properties of cumin seed. J. Agric. Eng. Res., 64: 93-98.
CrossRefDirect Link - Suthar, S.H. and S.K. Das, 1996. Some physical properties of karingda [Citrullus lanatus (thumb) Mansf.] seeds. J. Agric. Eng. Res., 65: 15-22.
CrossRefDirect Link - Tunde-Akintunde, T.Y. and B.O. Akintunde, 2004. Some physical properties of sesame seed. Biosyst. Eng., 88: 127-129.
CrossRefDirect Link - Unal, H., E. Isik and H.C. Alpsoy, 2006. Some physical and mechanical properties of black-eyed pea (Vigna unguiculata L.) grains. Pak. J. Biol. Sci., 9: 1799-1806.
CrossRefDirect Link - Yalcin, I. and C. Ozarslan, 2004. Physical properties of vetch seed. Biosyst. Eng., 88: 507-512.
CrossRefDirect Link