
B. Meenakshi
Anna University, Chennai, India
P. Anandhakumar
Department of IT, MIT, Anna University, Chennai, India
Information Technology Journal
Year: 2013 | Volume: 12 | Issue: 5 | Page No.: 1050-1054


ABSTRACT
Wireless Sensor Network (WSN) is a rapidly growing field of study, which consists of a large number of sensor nodes with low-power transceivers. The WSN is used as an effective tool for gathering data in a variety of environments, especially where human being unable to go into. The node deployment, effective architecture, routing and many other research activities are developed for WSN, which becomes new era in the networking world. Improving lifetime is one such research activity focused by many researchers in the past, in which efficient clustering and effective communication through cluster head are major research implementation. Clustering is the process in which the sensor nodes are segregated into groups based on its geographical position, this process of split communication will save energy. In addition to these cluster based communication, traffic free routing will opt effective WSN. This study proposes a traffic flow analysis based routing model which improves reliable data transfer and avoids data loss in the WSN.
PDF Abstract XML References Citation
Received: November 18, 2012;
Accepted: January 24, 2013;
Published: February 18, 2013
How to cite this article
B. Meenakshi and P. Anandhakumar, 2013. Traffic free routing using Path Load Factor in Wireless Sensor Networks. Information Technology Journal, 12: 1050-1054.
DOI: 10.3923/itj.2013.1050.1054
URL: https://scialert.net/abstract/?doi=itj.2013.1050.1054
DOI: 10.3923/itj.2013.1050.1054
URL: https://scialert.net/abstract/?doi=itj.2013.1050.1054
INTRODUCTION
In general, a WSN is similar to ad hoc networks on both application and implementation methodologies. An ad hoc network (Manoj, 2002) is a kind of network, in which, nodes are connected in distributed manner for a specific purpose such as traffic monitoring in a highway, disaster relief operations, fire fighters communication. The nodes in the WSN can be defined as self-configurable, forming a network with large number of conceivable combinations of sensing, computing, and communication technology.
The WSN is differentiated from ad hoc networks by the characteristics of the sensor node deployed in the WSN which has few limitations than ad hoc nodes like very low data rates over a large timescale, limited memory, lesser computational resource and limited battery power. Therefore the deployment, routing and other research activities are developed based on these limitations, which becomes new era in the networking world. Due to energy constraints, a sensor can communicate directly, only with other sensors that are within a small distance (Bao and Garcia-Luna-Aceves, 2010).
The implementation of WSN is analysed based on the following few metrics (Mohan and Baskaran, 2012):
| • | Type of service (TOS): WSN is expected to provide meaningful information and/or actions about a given task with additional concepts like scoping of interactions to specific geographic regions or to time intervals |
| • | Quality of service (QoS): Which is closely related to TOS, in addition to TOS, bounded delay or minimum bandwidth allocation, very high reliability, high packet delivery ratio are important parameters for QoS in WSN |
| • | Fault tolerance: In general, the sensor nodes may run out of energy or might be damaged; or due to mismatch of transmission range the communication between two nodes can be permanently interrupted. Hence the WSN is able to tolerate such faults through redundant deployment |
| • | Lifetime: In General, the sensor nodes are limited energy sources. Replacing these energy sources of nodes in the site is usually not practicable. Hence, the sensor node must operate at lesser moments instead of transmitting all packets, which will improve the life time of the sensor nodes. The precise definition of lifetime depends on the application at hand |
| • | Scalability: No of nodes deployed in the network to be increased by proper mechanism and protocol |
| • | Wide range of densities: Different applications will have very different node densities. The system should operate any range of signalling in order to communicate in any type of applications |
The detailed review of architecture, node deployment, various research issues and proposed implementation for WSN is available in Akyildiz et al. (2002) study who Akyildiz et al. (2002) reviews various architecture and deployment of WSN, research issues of WSN in detail. Akyildiz et al. (2007) reviews the extended survey of multimedia WSN. The survey on various research issues and challenges of virtual WSN are described by Youssef et al. (2009). From these three papers, it is concluded that the improvement of life time of WSN, traffic management, architecture and node deployment and routing are major research issues of the past few decades.
In WSN, the data collected by each sensor is communicated to a single processing centre (control station). The control station uses all collected data from the sensor nodes to determine the characteristics of the problem domain or detect an event. In this model, by limiting the energy resources the lifetime of the sensor may be improved. The Clustering of WSN improves lifetime and energy management of WSN.
Chamam and Pierre (2009) proposed an energy-optimal topology, the objective of the proposal is to maximize the network lifetime of WSN and to ensuring full area coverage. The author proposes cluster model and sensor connectivity to cluster heads, which forms a spanning tree, also leads to Integer Linear Programming model. From the spanning tree the author finds minimum spanning tree using tabu search to tackle the exponentially increasing computation time of the exact resolution and implements this as a routing model.
Charfi et al. (2009) proposed a novel clustering problem that aims at generating overlapping multi-hop clusters. Through analysis and simulation experiments, the author explains the method for selecting the different values of the parameters to achieve the clustering process objectives. Clustering is the process in which the sensor nodes are segregated into groups based on its geographical position. Hence the sensor nodes will communicate information only to cluster heads and then the cluster heads will communicate the aggregated information to the processing centre, this process of split communication will save energy.
This mechanism must provide the connectivity of every sensor to a Cluster Head (CH) at any time. Also the mechanism must ensure the transfer of data to be routed from any CH to the sensor nodes, all CHs have to belong to a single connected graph. Hence, the mechanism of sensor nodes will defines resource allocation to be optimal, optimal coverage range, any time connectivity of sensor nodes to CH. Akkaya and Younis (2005) reviews the requirement of WSN based routing protocol in detail.
Recent days, the swarm intelligence is applied for routing of WSN (Hongliang and Meng, 2006; Ramachandran et al., 2008; Saleem et al., 2011). The swarm improves routing model but the traffic free routing is major issue in the WSN. The traffic free routing will provide optimality in the WSN implementation which may reduce traffic, which leads to lesser data loss subsequently improve QoS, ToS. In our earlier work (Meenakshi and Anandhakumar, 2012), proposed cluster model for improving life time of the WSN.
Hence, this study concentrates the traffic free routing through the clustering model. The proposed routing protocol offers traffic free routing based on the traffic flow analysis in the WSN. The traffic flow analysis computes the dynamic traffic patterns and suggests low traffic routes.
PROPOSED PATH LOAD FACTOR - TRAFFIC FREE ROUTING (PLF-TFR)
Let the traffic model of WSN has each traffic flow ‘q’ described by a mean rate f′q and an additional rate f’=q Considering several flows {1, 2,...r}, statistical multiplexing affects the capacity required by the aggregated flow.
Assume that, if the flows are not aggregated, then the total needed capacity is:
| (1) |
The flows can be aggregated on each links, in such environment; the advantages of the proposed system are improving the statistical multiplexing and reducing the capacity requirements. Indeed it must meet QoS requirements of all demands (Mohan and Baskaran, 2011a). Since only one demand ‘q’ is assumed to take its highest value f′q + f”q at a time the capacity needed on the logical link is:
| (2) |
Logical links are mapped on physical paths and then on each nodes of WSN. On a single physical link multiple paths can be routed. The minimum capacity of a physical link can be obtained considering the above expressions for all circuits traversing it. Then the actual capacity of the physical link must be selected considering the discrete set of values provided by the transport technology (Ren et al., 2008).
For every time interval, (Δt), the sensor nodes will periodically propagate a tiny agent like ant (Di Caro and Dorigo, 1998; Di Caro et al., 2005) to every other sensor nodes which connected directly and or indirectly. Each sensor nodes calculates the load factor based on the data flow using the following Eq. 3. Where load factor is the term used to classifies the traffic pattern.
In this study, the load factor is classified as three models, which are low traffic, medium traffic and high traffic:
| (3) |
where, LFi represents the load factor of sensor node ‘i’, ARi represents the arrival rate of the concern sensor node ‘i’, Kq is the constant, QLi represents the Queue Length (or available memory) of the sensor node ‘i’, LCi represents the Link Capacity of the connection established from the sensor node ‘i’ and the TUi represents the Target Utility of sensor node ‘i’.
Routing decision is taken based on the load factor of the paths. The path having low traffic is the highly priority route. And the medium traffic path is low priority route. The high traffic path is always avoided in order to avoid traffic (Yu and Zhang, 2009).
Based on the Load factor, the traffic pattern is further classified. If the LF factor of the sensor node ‘i’ is less than 0.8 then this may be labelled as low traffic. The medium traffic is termed as load factor higher than 0.8 and less than 1 and the high traffic is termed as load factor higher than 1, which shown in the Eq. 4:
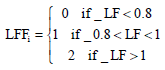 | (4) |
Every unit time, a flag called Load Factor Flag (LFF) is assigned to each sensor nodes of the WSN, the values of the LFF are 0, 1 and 2. The value of the LFF are assigned based on the load factor of the sensor nodes, suppose the node has low traffic then the LFF is assigned as 0. Similarly the LFF is assigned as 1 and 2 for medium load and heavy load. The Path Load Factor (PLF) is a value calculated as sum of the LFF of each node presents in the path, which shown in the Eq. 5:
| (5) |
When the sink node starts communication, the node identifies all possible paths to the control centre. The PLF values of the each path are calculated and the minimum of PLF is identified which is optimal than existing (Wu et al., 2010). This minimum PLF path is in term a low traffic path, the communication through this path avoids data loss.
RESULTS
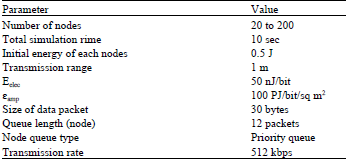
The proposed work is implemented in NS-2 (NS2), the simulation parameters are shown in the Table 1. The numbers of nodes in the simulation is varied from 20 to 1000. The simulation is carried out for 10 sec, the mean performance for 1 sec is computed (Akkaya and Younis, 2005) from this results. The initial energy of each node is assigned as 0.5 Joules. The transmission ranges of the nodes are defined as 1 meter based on Akyildiz et al. (2007). Data packets with the size of 30 bytes are transmitted using Priority Queues.
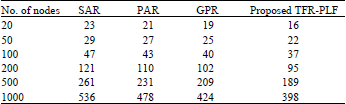
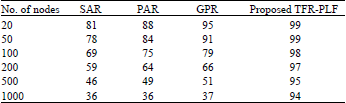
The proposed PLF-TFR is compared with the existing Power Aware Routing (PAR) (Bao and Garcia-Luna-Aceves, 2010), Sequential Assignment Routing (SAR) (Charfi et al., 2009) and Geographical Position Routing (GPR) (Chamam and Pierre, 2009).The comparison of PAR, SAR, GPR and proposed PLF-TFR method according to transmission delay, average delivery ratio and throughput are shown in the Table 2, 3 and 4, respectively.
Table 2 shows the delay in proposed and existing methods. The delay of the SAR ranges from 23 to 536, the PAR ranges from 21 to 478, the GPR ranges from 19 to 424 and the proposed method ranges from 16 to 398. From this result, the proposed method has reduced delay around 6 to 30% comparing the well-known existing methods. The Table 3 and 4 show the packet delivery ratio and throughput of the proposed system and existing system.
The packet delivery ratio of the proposed system is maintained around 95% comparing the well-known and recent existing methods (Mohan and Baskaran, 2011b), whereas the existing systems has 60-90% according to the number of nodes.
| Table 1: | Simulation environment in network simulator 2 |
 | |
| Table 2: | Comparison of delay |
 | |
| Table 3: | Comparison of packet delivery ratio |
 | |
| Table 4: | Comparison of throughput |
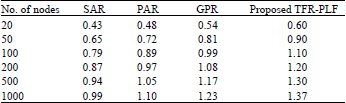 | |
The packet delivery ratio of the existing SAR ranges from 30 to 80%, the PAR ranges from 36 to 88%, the GPR ranges from 37 to 95% and the proposed work ranges from 94 to 99%.
In the existing methods, the packet delivery ratio are seems good in the more no of nodes, whereas, in the few nodes network, the existing methods does not optimal (Mohan and Baskaran, 2011b). The throughput of the proposed system is improved drastically than the existing methods. The result of the proposed method also shows improvement over the existing proposal (Meenakshi and Anandhakumar, 2012).
CONCLUSION
From the results and implementation, it is obvious that the proposed system has reduced delay, which in term increases packet delivery ratio and simultaneously the throughput. The result of the proposed system has improvements from 8 to 50% according to the number of nodes in the simulation environments. Therefore the proposed system will satisfy the objective which explained in the earlier section. Hence it is concluded that the proposed work proves that it is optimal than the well-known existing methods such as SAR, PAR and GPR.
REFERENCES
- Akkaya, K. and M. Younis, 2005. A survey on routing protocols for wireless sensor networks. Ad Hoc Networks, 3: 325-349.
CrossRefDirect Link - Akyildiz, I.F., W. Su, Y. Sankarasubramaniam and E. Cayirci, 2002. A survey on sensor networks. IEEE Commun. Mag., 40: 102-114.
CrossRefDirect Link - Akyildiz, I.F., T. Melodia and K.R. Chowdhury, 2007. A survey on wireless multimedia sensor networks. Comput. Networks, 51: 921-960.
CrossRef - Bao, L. and J.J. Garcia-Luna-Aceves, 2010. Stable energy-aware topology management in ad hoc networks. Ad Hoc Networks, 8: 313-327.
CrossRef - Chamam, A. and S. Pierre, 2009. On the planning of wireless sensor networks: Energy-efficient clustering under the joint routing and coverage constraint. IEEE Trans. Mobile Comput., 8: 1077-1086.
CrossRef - Mohan, B.C. and R. Baskaran, 2012. A survey: Ant colony optimization based recent research and implementation on several engineering domain. J. Exp. Syst. Appl., 39: 4618-4627.
CrossRefDirect Link - Mohan, B.C. and R. Baskaran, 2011. Survey on recent research and implementation of ant colony optimization in various engineering applications. Int. J. Comput. Intell. Syst., 4: 566-582.
Direct Link - Charfi, Y., N. Wakamiya and M. Murata, 2009. Challenging issues in visual sensor networks. IEEE Wireless Commun., 16: 44-49.
CrossRef - Di Caro, G. and M. Dorigo, 1998. AntNet: Distributed stigmergetic control for communications networks. J. Artif. Intell. Res., 9: 317-365.
CrossRefDirect Link - Di Caro, G., F. Ducatelle and L.M. Gambardella, 2005. AntHocNet: An Adaptive nature-inspired algorithm for routing in mobile ad hoc networks. Eur. Trans. Telecommun., 16: 443-455.
CrossRefDirect Link - Hongliang, R. and M.Q.H. Meng, 2006. Biologically inspired approaches for wireless sensor networks. Proceedings of IEEE the International Conference on Mechatronics and Automation, June 25-28, 2006, Luoyang, Henan, pp: 762-768.
CrossRef - Ramachandran, C., S. Misra and M.S. Obaidat, 2008. A probabilistic zonal approach for swarm-inspired wildfire detection using sensor networks. Int. J. Commun. Syst., 21: 1047-1073.
CrossRef - Ren, G., Z. Wu, N. Zhao and M. Lin, 2008. A mutated ant colony optimization algorithm for multiuser detection. Inform. Technol. J., 7: 948-952.
CrossRefDirect Link - Saleem, M., G.A. Di Caro and M. Farooq, 2011. Swarm intelligence based routing protocol for wireless sensor networks: Survey and future directions. Inform. Sci., 181: 4597-4624.
CrossRefDirect Link - Wu, Z., Y. Kuang, N. Zhao and Y. Zhao, 2010. A hybrid CDMA multiuser detector with ant colony optimization and code filtering system. Inform. Technol. J., 9: 818-824.
CrossRefDirect Link - Youssef, M., A. Youssef and M. Younis, 2009. Overlapping multi-hop clustering for wireless sensor networks. IEEE Trans. Parallel Distrib. Syst., 20: 1844-1856.
CrossRef - Yu, X. and T. Zhang, 2009. Convergence and runtime of an ant colony optimization model. Inform. Technol. J., 8: 354-359.
CrossRefDirect Link