
Nian Zhang
Taiyuan University of Science and Technology, China
Minjie Jin
Taiyuan University of Science and Technology, China
Information Technology Journal
Year: 2013 | Volume: 12 | Issue: 13 | Page No.: 2489-2496


ABSTRACT
Altitude height has an important effect to the tunnel fire combustion characteristics. In this study it combined fire model experiment with numerical simulation methods to study on temperature distribution characteristics of the high-altitude tunnel fire. It took tunnel fire model experiments in the discharge tunnel of Guanjiao Tunnel (32.645 km) and established the numerical model of high-altitude tunnel fire. It verified the numerical model with experimental data and studied on temperature distribution characteristics of the high-altitude tunnel fire with the numerical model finally. It obtained: Fire power was decided by the size of the fire area which also affected temperature distribution characteristics; the difference of the temperature in the tunnel between high-altitude and low-altitude was little under the condition of the same fire power; the temperature in the high-altitude tunnel was lower under the condition of the same fire size.
PDF Abstract XML References Citation
Received: May 20, 2013;
Accepted: August 01, 2013;
Published: September 21, 2013
How to cite this article
Nian Zhang and Minjie Jin, 2013. Numerical Simulation and Experimental Study on Characteristics of Fire in High-altitude Tunnels. Information Technology Journal, 12: 2489-2496.
DOI: 10.3923/itj.2013.2489.2496
URL: https://scialert.net/abstract/?doi=itj.2013.2489.2496
DOI: 10.3923/itj.2013.2489.2496
URL: https://scialert.net/abstract/?doi=itj.2013.2489.2496
INTRODUCTION
Tunnel fire always causes the serious personnel injury and death, as well as huge social effect and economical loss (Huang et al., 2002; Li et al., 2010). In order to reduce the personnel and property loss under the condition of tunnel fire, it is necessary to research the burning feature of the tunnel fire in high-altitude tunnels.
Currently, there are many researches on the tunnel fire in China and abroad (Tu, 1997; Zhahg et al., 2003; Kim et al., 2008; Nilsen and Log, 2009; Hong and Liu, 2005; Chu and Wu, 2012; Wieser et al., 1997; Kong et al., 2002; Yingbo, 2011) and many conclusions have been reached. However, such researches are basically performed in the low-altitude regions. Under the condition of high-altitude (Kong et al., 2002; Yingbo, 2011; Zhang et al., 2011), there exist two problems on the calamity-preventing and rescuing in the tunnels. First is that the air buoyancy is low, the rules of the distribution and spread of the temperature field and smog field in the tunnel are different from those of the general channels. The second is that, the air in the high-altitude tunnel is thin and the oxygen content, air pressure and air temperature are also very low. In this region, the movement of the person (escaping speed) is greatly restricted. It is great necessary to perform the further research on the fire in the high-altitude tunnel, so as to make better prevention and rescuing to the fire in such tunnels.
The method combining tunnel fire model testing and numerical modeling is used in this article to research the feature of the temperature distribution in the fire in high-altitude tunnels. The fire model testing in high-altitude tunnel was performed in the discharge tunnel of Guanjiao Tunnel (32.645 km) and it used the data of model testing to verify the high-altitude mathematical model. It also utilized the mathematical model to analyze the features of temperature distribution of the fire in the high-altitude tunnels.
GENERAL SITUATIONS OF THE TUNNEL FOR TESTING
The total length of Guanjiao Tunnel is 32.645 km and it is located in Qinghai-Tibet Plateau and the average altitude there is more than 3300 m, such tunnel belongs to the high-altitude super-long railway. The average annual temperature there is -0.5°C and the lowest temperature in winter is -35°C, there is not summer all the year and the weather condition is very wicked. The model tunnel selected for the test is the discharge tunnel of Guanjiao Tunnel. The total length of the model tunnel in the testing section is 34 m and its internal diameter is 1.35 m.
METHOD OF THE FIRE MODEL TEST IN THE TUNNEL
Measurement of the fire temperature test: In this fire model test, the temperature at the arch crown of the tunnel is mainly monitored and measured.
The thermocouple is one of the general temperature-measuring instruments in the fire test. The K-style thermocouple is used in this test and its direct measurement range is 0 to 1300°C, the measurement accuracy is 0.1°C and the diameter of the thermocouple is 3 mm.
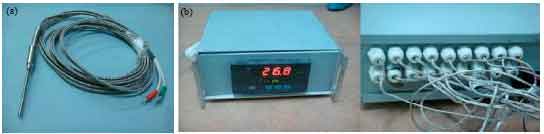 | |
| Fig. 1(a-b): | Thermocouples and temperature patrol instruments used in the test, (a) Thermocouple and (b) Temperature patrol instrument |
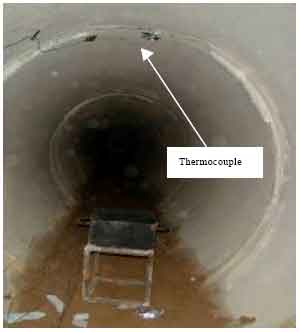 | |
| Fig. 2: | Thermocouples arranged at the vault in the test |
 | |
| Fig. 3: | Arrangement of thermocouples and the fire in the test |
In the test, two 16-routine inspecting instruments (Fig. 1) will collect the temperature data from the thermocouple. The inspecting instruments will be connected to the computer and the temperature sampled by the thermocouple will be sampled by the corresponding sampling software (Configuration King-the temperature sampling software). It will be converted to the real-time measurement value of temperature and displayed on the screen and the data will be save in a real-time way for further processing at the same time.
The rmocouples will be placed at the top of the tunnel as shown in the Fig. 2 to collect the temperature. The total length of the testing section of the tunnel is 34 m and there are 9 data collection points altogether, as are shown in the following drawing:
Setting of the fire: The longitudinal wind in the test tunnel is the natural wind, the fire is set at the place 12 m far away from the entrance of the tunnel. The center of the fire is set as the original point of the distance measurement as shown in the Fig. 3.
The oil pan was used as the fire source for testing and the dimension of the single oil pan is 23 cm (length)x23 cm (width)x10 cm (height). The power rate can be determined by the fire power test (Zhang et al., 2011). The power rate can be determined by the fire power test, the oil pan Heat Release Rate (HRR) curve is shown as the Fig. 4.
The fire height was set to be 0.2 m in the tunnel. The size of lacquer tray was 23x23 cm, the fuel type was 93# gasoline, the fire power was about 23 kW and the wind velocity was 0.3 m sec-1.
Combustion of the fire in the test: Combustion of the fire in the test is shown as the Fig. 5.
The natural wind speed in the tunnel is not very large and it is mainly 0.2-0.5 m sec-1 and the average wind speed is about 0.3 m sec-1, the wind direction keeps constant, from inlet to outlet. Therefore, in the photos of Fig. 5 it can see that, the flame of the fire is a bit slant and its direction is tending to the downstream of the tunnel all the time and the flame is basically not disturbed and the combustion is stable. From the figures it can also see that the density of the smoke released along with the combustion is increasing gradually, until it spreads to fill the entire tunnel.
Distribution of the temperature at the tunnel vault: The procedure of the fire is dynamic and the distribution of the longitudinal temperature changes along with the time. The following Fig. 6 gives the variation of the temperature with time at the tunnel vault, as well as the longitudinal distribution of the temperature at the tunnel vault in the test after the fire (t = 200, t = 400, t = 700, t = 900 and t = 1200).
From Fig. 6 it can see that, the fire temperature in the tunnel varies along with the time and it shows the tendency of decreasing after increasing, which meets the rule of the fire.
 | |
| Fig. 4: | HRR curve of 23x23 cm oil pan in the test |
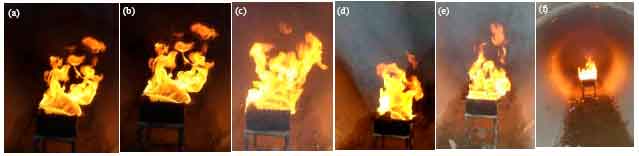 | |
| Fig. 5(a-f): | Combustion of the fire at different time in the test (a) 60 sec, (b) 180 sec, (c) 300 sec, (d) 480 sec, (e) 600 sec and (f) 1200 sec |
 | |
| Fig. 6(a-b): | Variation of temperature with time at the tunnel vault in the test, (a) Different distance and (b) Different time |
The temperature at the tunnel vault above the fire source is always the largest at any time. Along with the increasing of the distance between the probe and the fire, the temperature at the tunnel vault decreases. Wind velocity affects the temperature distribution, because of the longitudinal wind. The hot smoke is gathering at the downstream of the tunnel, therefore, the temperature at the downstream is relatively higher. The temperature measured at downstream is higher than that measured at the upstream under the condition of the same distance to the fire.
VERIFICATION OF THE NUMERICAL MODEL FOR THE TUNNEL FIRE
The simulate calculation by computer has become a very important method during the fire research, via the simulation of the fire scene, the full procedure of fire can be displayed simply and dynamically. The relative accurate fire parameters can be obtained by the calculation, such as the temperature and smoke field distribution, etc. This study will use STARCCM+ to perform the numerical simulation of the fire in the high-altitude tunnel and the data obtained from the model test will be used to verify the numerical model.
Theory of tunnel fire model: The burning flow is a kind of 3D and unsteady turbulence flowing along with substance and energy transferring. The smoke motion during the tunnel fire is controlled by law of conservation of mass, Newton’s second law, law of conservation of energy and law of conservation of component transport. The mathematical description of such laws composes the basic equation group of chemical fluid mechanics and plus k-ε turbulence double-equation flowing model they compose the closed equation group controlling the smoke movement and its general form is:
In the equation:
where, is unsteady item, which describes the variation of the physical amount along with time; ![]() is the convection item, which describes the motion exchanging among the physical amounts;
is the convection item, which describes the motion exchanging among the physical amounts; ![]() is the diffusion item, which describes the variation of the physical amounts along with the space location; Sφ is the source item, which describes various kinds of acting forces on the gas.
is the diffusion item, which describes the variation of the physical amounts along with the space location; Sφ is the source item, which describes various kinds of acting forces on the gas.
Because of the complexity of the tunnel fire and in order to simplify the calculation procedure, under the conditions of meeting the engineering accuracy, some secondary factors can be neglected and it supposed as the following:
| • | Process the burning fire source as the heat source with certain geometrical dimension |
| • | The burning procedure in the fire as well as the variation of the smoke ingredients caused by chemical reactions is not taken into consideration |
| • | The radioactive heat exchange in the hot smoke layer is neglected |
| • | The effects of the buoyance of hot smoke should meet the Boussinesq similarity, β (Tf-Tref) = ρref–ρ |
| • | The effects of the thermal expansion, viscous dissipation and pressure work to the smoke flowing motions are neglected |
Establishment of the tunnel model: The coordinate should be established with the place 12 m far away from the inlet of the central line of the tunnel as the original point and the cross-section of the tunnel in the simulation is shown as the Fig. 7.
The primary conditions of basic setting: The temperature in the testing tunnel is 16.8°C and the average air pressure outside of the tunnel (for many years) is 672.61 hpa, the air density is 0.843 kg m-3. According to the average measured wind velocity, the natural wind velocity at the inlet is about 0.3 m sec-1.
The fire power rate is about 23 kW.
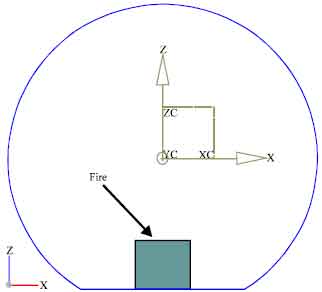 | |
| Fig. 7: | Cross-section of the tunnel in the simulation |
From the simulation it can see that, the procedure of the fire can be divided into three phases. The attenuation phase of the fire was not taken into consideration during the numerical simulation, therefore, there will be not the phase of temperature decrement. During the numerical calculation, along with the stability of burning, the temperature in the tunnel will not change since it reaches the maximum value. Based on this, it only consider the comparison among the maximum temperatures at the tunnel vault.
Results of model calculation: By calculation, it can obtain the comparison between the predicted values of the maximum temperature at the tunnel vault in the calculation model and the data got in the test, as is shown as the Fig. 8.
From the Fig. 8 it can see that, results of the numerical simulation and the test are similar and maximum temperature values at the tunnel vault obtained at probe points are basically the same. Generally speaking, besides individual points, results of the numerical calculation are a bit larger than model test values. However, the gap between the two is not very large and the average difference is 5 to 6% and they can meet the requirement basically.
On the consideration of the comparative analysis of the model testing data and the numerical simulation calculation, it have verified the established numerical model and the result is satisfying. It indicated that the numerical method is feasible in terms of calculating the tunnel fire and it can be applied in the prediction and analysis after the actual tunnel fire.
 | |
| Fig. 8: | Comparison curves of results between the test and simulation |
RESEARCH ON THE COMBUSTION CHARACTERISTIC OF THE FIRE IN THE HIGH-ALTITUDE TUNNEL
The previous research has verified the reliability of the numerical calculation model of the tunnel fire. The established tunnel fire model will be used to perform the simulating comparative analysis to the burning feature of the tunnel fire in the low-altitude and high-altitude areas, so as to obtain the distribution characteristic of temperature of the fire in the high-altitude tunnel.
Taking the tunnel used in the previous tunnel fire model test as the prototype, it can perform the numerical simulation calculation for the tunnel fire. According to the calculation experience, the numerical simulation calculation will be more reliable when the wind velocity is slow. In the actual situation, the calculation is performed under the condition of low wind velocity (the average velocity is 0.3 m sec-1) and the initial temperature of the calculation is set to be the same, it is 15°C.
The test condition of the discharge tunnel of Guanjiao tunnel is used as the environmental parameters in the tunnel in high-altitude area and the test condition in Taiyuan is used as the environmental parameters in the tunnel in low-altitude area (Zhang et al., 2011). All fire sources in the calculation are set to be 93# gasoline and the environmental parameters for calculation and the setting of the fire source are shown in the Table 1 and 2.
By the calculation, it can obtain the temperature distribution at the tunnel vault during the tunnel fire under conditions of different altitudes, as is shown as the Fig. 9.
From Fig. 9 it can see that, the tendency and characteristics of the longitudinal temperature distribution in high-altitude and low-altitude tunnel are basically the same during the fire in tunnels. The temperature will decrease when the distance between the probe point and the fire center increases. Under the condition of same distance, the temperature at the downstream of the fire source is higher than that at the upstream.
| Table 1: | Environment parameter settings in the model |
 | |
| Table 2: | Fire settings in the simulation |
 | |
 | |
| Fig. 9(a-b): | Comparison curves of longitudinal temperature distribution at tunnel vault under different conditions, (a) Different power rate and (b) Different fire size |
It also can see in the figure that the larger the fire power rate is, the temperature of the tunnel during the fire will be higher.
Figure 9a shows that, when there is a tunnel fire, the distribution of the temperature in the tunnel has no large difference between high-altitude tunnel and low-altitude tunnel under the same fire source power rate. The temperature at the tunnel vault is higher under low-altitude tunnel than under high-altitude tunnel, however, the value is basically within 3°C.
Figure 9b shows that, under the condition of the same fire dimension, the tunnel temperature in high-altitude tunnel is higher than that in low-altitude tunnel and the difference is very large. The reason is: The fire power rate in the high-altitude area is obviously lower than that in the low-altitude area under the condition of same fire dimension and it causes the large difference of the temperature distribution in the tunnel. On the other hand, it indicates that controlling the burning area of the fire is very important when there is the fire in the tunnel, it determines the fire power rate and it also affects the temperature distribution of the fire in the tunnel.
CONCLUSION
In this study, it combined fire model experiment with numerical simulation methods to study on temperature distribution characteristics of the of high-altitude tunnel fire. The main conclusions are as the following:
| • | The tendency and characteristics of the longitudinal temperature distribution in high-altitude and low-altitude tunnel are basically the same during the fire in tunnels and the temperature will decrease when the distance between the probe point and the fire center increases. Under the condition of same distance, the temperature at the downstream of the fire source is higher than that at the upstream |
| • | Under the condition of the same fire dimension, the tunnel temperature in high-altitude tunnel is higher than that in low-altitude tunnel |
| • | Under the condition of the same fire power rate, the difference of the temperature in high-altitude and low-altitude tunnel is not very large |
ACKNOWLEDGMENT
This study is sponsored by the Dr. start fund of Taiyuan University of Science and Technology (20122040) which is gratefully acknowledged.
REFERENCES
- Nilsen, A.R. and T. Log, 2009. Results from three models compared to full-scale tunnel fires tests. Fire Safety J., 44: 33-49.
Direct Link - Chu, L. and S.J. Wu, 2012. A real-time fire evacuation system with cloud computing. J. Convergence Inform. Technol., 7: 208-215.
Direct Link - Wieser, D., P. Jauch and U. Willi, 1997. The influence of high altitude on fire detector test fires. Fire Safety J., 29: 195-204.
Direct Link - Kong, W.J., A. Tuerxun, W.G. Wang, W.F. Du and X.Q. Zhang, 2002. On the ignition characteristics over a thermally thin fuel heated by external radiation in different gravity environment. J. Eng. Thermo-Phys., 23: 111-114.
Direct Link