
R. Bayir
Department of Electronic and Computer, Faculty of Technical Education, Karabuk University, 78050, Karabuk, Turkey
Journal of Applied Sciences
Year: 2008 | Volume: 8 | Issue: 18 | Page No.: 3148-3156


ABSTRACT
In this study, a Graphical User Interface (GUI) software for real time condition monitoring and fault diagnosis of serial wound starter motors has been developed using Learning Vector Quantization (LVQ) neural network. The starter motors are serial wound dc motors which enable the Internal Combustion Engine (ICE) to run. When the starter motor fault occurs, the ICE cannot be run. Therefore, condition monitoring and pre-diagnosis of starter motor faults are important. The information of voltages and currents is acquired from the starter motor via data acquisition card and transferred to the program. With this program using LVQ network, six faults observed in the starter motors were successfully detected and diagnosed in real time. The GUI software makes it possible to condition monitoring and diagnose the faults in starter motors before they occur by keeping fault records of the past occurrences. This system can be used in service shops and in test departments of starter motor manufacturers. In addition, this system has potential to be used for real time condition monitoring and fault diagnosis of vehicles with the help of industrial computers.
PDF Abstract XML References Citation
How to cite this article
R. Bayir, 2008. Condition Monitoring and Fault Diagnosis of Serial Wound Starter
Motor with Learning Vector Quantization Network. Journal of Applied Sciences, 8: 3148-3156.
DOI: 10.3923/jas.2008.3148.3156
URL: https://scialert.net/abstract/?doi=jas.2008.3148.3156
DOI: 10.3923/jas.2008.3148.3156
URL: https://scialert.net/abstract/?doi=jas.2008.3148.3156
INTRODUCTION
Although electric motors are well mounted and robust, faults may occur during runtime. Unexpected breakdown of electric motors causes both monetary losses and replacement of the motors earlier unless required precautions are taken by diagnosing the faults. Therefore, it is important to diagnose and detect the faults before they occur (Subhasis et al., 2005). Electrical faults, mechanical faults or combination of them may take place in electric motors (Finley and Burke, 1994).
It may take time to detect the faults occurred in electric motors. By means of condition monitoring of electric motors and fault diagnosis, both security and reliability of the motor are enhanced. There are different fault diagnosis methods that detect and pre-diagnose the faults of electric motors. Each of these methods comprises different scientific methods and technologies (Vas, 1993; Chow, 1997).
While fault diagnosis and detection, online monitoring and quality control of dc motors getting more importance, the interests of scientist`s and engineering`s have also increased. Fault diagnosis of those motors is being implemented by specialists using conventional techniques. Those conventional techniques can not meet all of the demands (Liu et al., 2000; Hajiaghajani et al., 2004). Taking into consideration that being specialist on this field is difficult, the fault diagnosis systems using artificial intelligence techniques in electric motors are becoming more important.
There have been studies being carried out on fault diagnosis of electric motors using artificial neural networks (Chow et al., 1993a, b; Yang et al., 2004; Marzi, 2004; Bay and Bayir, 2005; Selaimia et al., 2006; El-Shafei et al., 2007). One of these artificial neural networks is LVQ neural network. Faults of rotating machine could be detected by using LVQ neural network. Wear, tight and loose connection, eccentrically connection and normal conditions have successfully been detected by LVQ neural network using the real time torque data acquired from computer (Tse et al., 1995).
Rotating machine faults are successfully diagnosed by Self Organizing Map (SOM) and LVQ networks using high level statistics data as input data (Wang and Too, 2002). In rotating parts; unbalance, bad balance, very bad balance, bedding and bad bedding faults and normal condition of their components and rotating parts have been successfully diagnosed. LVQ network has been used for fault diagnosis of electric machines using vibration signals (Wang and Xu, 1996). Bearing wear caused by false connection of connection shaft, clang of connection shaft in resonance and normal condition of motor have been successfully diagnosed. In another study, faults have been diagnosed by using three different artificial neural networks to diagnose the faults of damaged and worn gear box using vibration signals. From the earlier, it has been determined that LVQ has classified in 80% accuracy (Abu-Mahfouz, 2005).
It is decided by LVQ that whether the parameters of wavelet transform of sound signals measured from the transmission equipments are bad or not (Wang et al., 2003). LVQ has been successfully used to determine leakage voltage and stability of voltage transition in electric distribution systems. Electric distribution systems are protected by predetermination of the conditions mentioned above (Vera-Candeas et al., 2006).
Sheet metal stamping process is widely used in industry due to its high accuracy and productivity. To identify the faulty conditions of this process, the Learning Vector Quantization (LVQ) networks are used as a classifier with the Hilbert marginal spectrum as the input vectors. The performance of this method has been tested by 107 experiments derived from different conditions in the sheet metal stamping process. Artificial defects are detected with a success rate of 96.3% (Bassiuny et al., 2007).
The application of neural networks and fuzzy logic to the diagnosis of faults in rotating machinery was investigated. The Learning Vector Quantization (LVQ) neural network was applied in series and in parallel to a fuzzy inference engine, to diagnose faults in rotating machinery. Investigated faults were unbalance, misalignment and structural looseness. The effectiveness of the integrated neural network and fuzzy logic method was illustrated (El-Shafei et al., 2007).
In this study, the faults that could be occurred in serial wound starter motor are diagnosed and condition monitoring was performed in real time via LVQ network.
TRANSFERRING THE CURRENT AND VOLTAGE SIGNALS OF STARTER MOTOR INTO GUI PROGRAM
Starter motors are dc motors running under heavy duty. However, they have some different electrical and mechanical parts compared to conventional dc motors. This makes them more complicate (Bolenz, 1995; Denton, 2006). Starter motor has vital importance for vehicles. For this reason, it is crucial to detect and diagnose the starter motor faults before they happen (Denton, 2004; Bayir and Bay, 2004). Finding that whether there is a fault in starter motor or not is called as detection and determining that where the fault is caused by is called as diagnosis.
To acquire the current and voltage signals of the starter motor, the electrical connections in the ICE test rig were arranged as shown in Fig. 1. Current and voltage data is transferred to GUI program using Advantech 1716 HG data acquisition card. This card was selected as it could be used real time controllable via Visual Basic 6.0. Analog input and output of this data transceiver card has 16 bit resolution. The sampling rate of the card is 250 kS sec-1. The current sensor is based on hall-effect technology and used to measure both DC and AC current values. This sensor may be also used in conjunction with multimeters, recorders and other suitable equipments. Measurement range of this sensor is 200A ACRMS or DC, besides a resolution of ±100 mA.
In this study, the starter motor current (Im) and voltage across the motor (Vm) were measured. The value of Vm is the sum of the voltage drops of field winding and of armature. The value of Im is the current flowing through the field winding and armature. In the experiments, the starter motor was examined for the cases when the ICE was allowed to run and not allowed to run. Table 1 shows technical specifications of a Mako`s Starter motor, which is used in experimental test.
In Fig. 2, the current drawn by the normal starter motor and the voltage drop across the starter motor was measured when the ICE was allowed to run. When ICE was not running, for the current drawn by and the voltage across a normal starter motor, a small ripple was observed for each piston movement (Bayir and Bay, 2004). The signals of other faults observed in the starter motors are shown in Fig. 3 as current (I) and voltage (V) graph. By locating voltage as X axis and current as Y axis, a pattern is formed for each fault. The pattern of each fault is formed differently (Fig. 3a-i). These differences are used to detect and diagnose the faults (Bay and Bayir, 2005).
| Table 1: | The sample of technical specifications of a Mako`s starter motor |
 | |
 | |
| Fig. 1: | Test rig where the signals of starter motor was measured |
 | |
| Fig. 2: | The signals of current and voltage of the starter motor when it is in normal condition and when ICE is running |
The case of battery fault and the case of connection fault (when the connections of poles are loose) are shown in Fig. 3a and b, respectively. The case of solenoid fault, the case of short circuit of field windings among its own windings and the case of looseness of armature and the case of having a broken wire in armature windings are all shown in Fig. 3a-f, respectively.
Although, the starter motor is normal in Fig. 3g, if there is a problem in ICE, the I/V graph of the current drawn and the voltage across the starter motor becomes similar to that in Fig. 3h. When the starter motor and ICE is normal and ICE is allowed to run, the current drawn by starter motor becomes quite variable. The load of the starter motor decreases as ICE begins to run and the current drawn from the battery by the starter motor becomes in negative values as alternator begins to give voltage to mains (Fig. 3i). If the current is in negative values, it could be considered that the ICE began to run. Besides, this feature provides an easiness to classify the case.
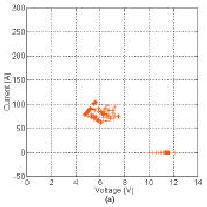 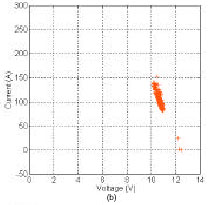 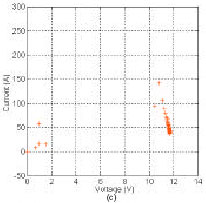 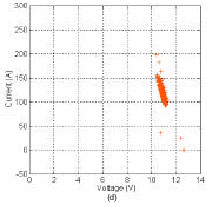 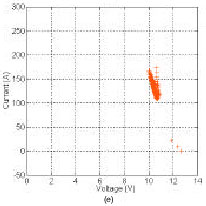 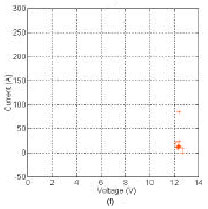 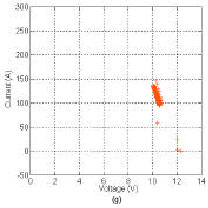 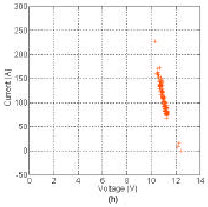 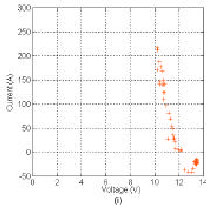 | |
| Fig. 3: | Current/voltage graphs of starter motor faults (a) battery fault (b) connection fault (c) solenoid fault (d) field winding fault (e) armature fault (f) armature coil broken fault (g) starter motor is normal (h) starter motor is normal but ICE has problems and (i) starter motor is normal and ICE is running |
FAULT DIAGNOSIS AND DETECTION USING LEARNING VECTOR QUANTIZATION NETWORK
Learning vector quantization network: Learning Vector Quantization (LVQ) network is a type of hybrid competitive network that uses both unsupervised and supervised learning to classify datasets. This network is generally used for classification problems (Kohonen, 2001). LVQ network is composed of 3 layers as input layer, Kohonen layer and linear layer (Fig. 4). Ability of Kohonen layer to classify input vectors and to learn distribution of input vectors is very high (Haykin, 1999). Neural nodes represent vectors distributed on a plane. Neural cells on Kohonen layer calculate their own values according to discrimination function. This discrimination function is the basis of the competition among neural cells and provides the determination of neural cells which are topologically around the winning neural cell. Thus, cooperation between neighboring neural cells is provided. The own values of these determined neighboring cells are increased according to discrimination function depending on input signal. Besides, connection weights of these neural cells are adjusted to an appropriate value (Fausett, 1993).
 | |
| Fig. 4: | Structure of learning vector quantization network |
Which group or class is the winning vector is determined in linear layer. Classification of input data during training is performed according to the rule of the nearest neighborhoods. The nearest distance between input vector and reference vector is searched and it is assumed to be a member of the vector which is in the nearest distance to input vector. By changing the weight of the network, the reference vector which will classify inputs correctly is determined. In training, the value of the winning vector which is the nearest vector to input vector is changed. As other artificial neural networks, learning weights are changed according to learning coefficient. In this network structure, learning coefficient is reduced to be 0 in time. The learning speed of LVQ network is faster when compared to multi-layered neural networks.
Training of learning vector quantization network: The algorithm of the LVQ network aims to reach the nearest output value to the input vector. Assuming that x points to target vector (x1….., xi,….. xn) and wj points to weight vector (w1…, wij,….. wnj) of node of j; if x and wj is in the same group then the weight of the new input vector changes towards these values. If x and wj is in different groups then the weight diverges from the new vector. The algorithm of the LVQ network could be performed with 6 steps (Fausett, 1993):
| Step 1: | Reference vector and learning ratio α(0) are determined |
| Step 2: | The steps from 2 to 6 are repeated until the clause evaluates to false |
| Step 3: | For each of the input vectors which are used in training, steps 3 and 4 are repeated |
| Step 4: | The value of j when ||x-wj|| is minimum is calculated. The value of wj is changed as follows: |
| • | If T = Cj then the winning node is the member of the correct class. In this case, weight values are made close to input vector (Eq. 1). This is done in order to make the node win again when same input vector or other input values close to that node are applied from input: |
| wj(new) = wj (old) + α (x- wj (old)) | (1) |
| • | If T≠ Cj then winning node is in wrong class. In this case, weight vector is moved away from the input vector (Eq. 2). This is done in order to avoid winning the node again when this input vector or another vector with the values are close to this vector is applied to input. |
| wj(new) = wj (old) - α (x- wj (old)) | (2) |
| Step 5: | Learning ratio is reduced |
| Step 6: | Stop condition is controlled. Training of the network could be stopped when the number of iteration is completed or when learning ratio is adequately decreased (Fausett, 1993) |
In Eq. 1 and 2; α represents learning ratio, T represents correct classification or class of training vector, Cj represents category to be classified or output node of j, ||x-wj|| Euclidean distance represents the distance between input vector and weight vector of output node of j.
The performance of the LVQ network is in close relation with determination of the reference vector in correct number, random values of the weights assigned at the beginning and the value of the learning coefficient. The case of the learning coefficient being not 0 in time is forgotten of the network of learned values in other words divergence of the values of correct weights. Another drawback of this network is to determine to which class the vector that is in between or in the boundary of two groups belongs when groups to be classified are close to each other. These cases cause the network to misclassify.
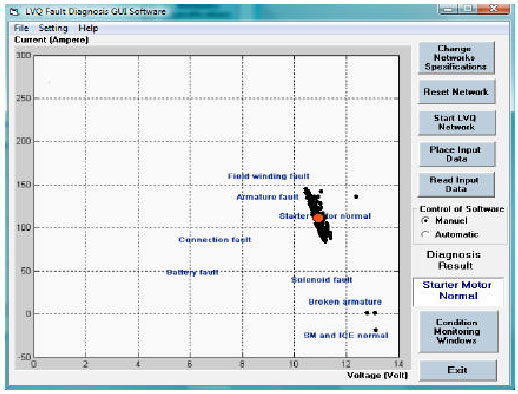 | |
| Fig. 5: | The main window of the user interface software designed to detect and diagnose faults |
Graphical user interface design for starter motor condition monitoring and fault diagnosis: The data acquisition card connected to the computer can easily be controlled by a programming language with dll file provided by the manufacturer. External data (current and voltage of starter motor) is transferred to the data acquisition card by the sensors. Data taken to the program is normalized and applied to input of the LVQ network. The main window of the user interface software designed to detect and diagnose the faults of starter motor in real time is shown in Fig. 5.
The user can change the parameters (number of input neurons, learning ratio) of LVQ network. In this study, one hundred input elements are used in input layer of the LVQ network. Learning ratio of the network is 0.001. Eight neurons were chosen in output layer. This number, at the same time, shows the number of conditions of the starter motor to be classified. The number of neurons in hidden layer of LVQ was chosen as 200.
By pressing start LVQ network, fault detection and diagnosis using LVQ network is performed. However, first, data is to be placed to I/V graph. As shown in Fig. 5, the software indicates the result of the diagnosis of LVQ network as a circle in I/V graph. The result found is expressed to user with a textbox in the same window. The user can make these processes automatically. This can be done by making electrical connections in test stand and choosing automatic option in software control. The user can also perform all the processes manually.
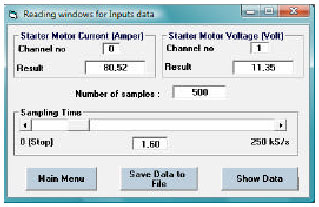 | |
| Fig. 6: | Window prepared to read input data real time |
The window in Fig. 6 is used in order to transfer current and voltage data of starter motor to computer real time. Using this window, sampling speed, number of data to be sampled and which channel of data acquisition card will be used to input can be adjusted. Adjustment of analog input voltage intervals of the card is not allowed to be selected by the user for security of the card. The obtained data, if desired, can be saved to an excel file. The user can see the data by pressing show data button to examine.
Condition monitoring window of a starter motor is shown in Fig. 7. From the Fig. 7, whether the starter motor has a changed parts or not, the starter motor specifications and its condition monitoring depending on the time can be seen.
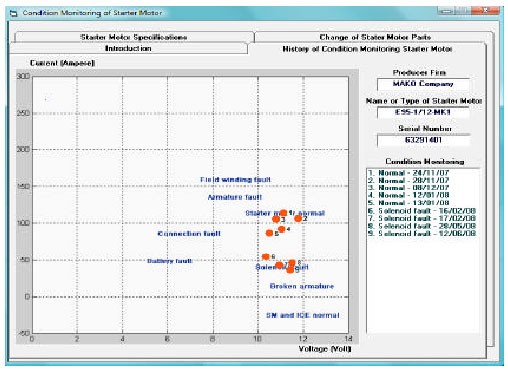 | |
| Fig. 7: | Condition monitoring of the starter motor window |
At introduction tab, the user can see list of registered starter motor by special register number. The user can also record a new starter motor. The system creates a*.mdb file for each starter motor. In condition monitoring of a starter motor, date, time and how long the starter motor is worked and results of LVQ network are also recorded to the file of the starter motor.
These defects have been classified by LVQ neural network. Classification results and starter motor records are recorded backwards. The system determines when the condition of starter motor deteriorates or before a defect take places. At the I/V graph of winner cell, by following the place shown for each diagnosis, which defect of starter motor is going to be happened can be determined (Fig. 7). By means of this feature, starter motor faults can be diagnosed beforehand.
RESULTS AND DISCUSSION
A correct diagnosis result with LVQ network is shown in Fig. 8a. The software indicates the fault diagnosis result (battery fault) with a circle. The wrong classification result occurred when starter motor is normal and ICE is not allowed to run is shown in Fig. 8b. When starter motor is normal and ICE is not allowed to run, since data cover wide area in I/V graph, LVQ network results in more than one points. As a result of classification performed under these conditions, it`s difficult to determine the faults correctly.
Wrong diagnoses are occurred, when pattern of the faults covers wide area in I/V graph. In those cases, the network indicates more than one fault as result. When more than one result occurs at the same time, by determining with software which point is close to which fault region, that fault is indicated as the result. When ICE is allowed to run, although starter motor is normal, armature fault is indicated as result. Besides, the wrong classifications of connection fault as battery fault, armature broken fault as solenoid fault and field winding fault as armature fault are resulted from that these fault regions are close to each other.
The faults observed in starter motor and starter system like connection fault, battery fault, armature fault, field winding fault and solenoid fault were detected using LVQ network when starter motor was normal and ICE had problems and allowed to run. LVQ network was tested for 64 samples and resulted in 91% correct classification.
With the help of learning starter motor faults before they occur and/or get worse, the user take necessary precautions. Taking into consideration the difficulties of having experts on fault diagnosis, the importance of these studies increases significantly. This system developed can be used to condition monitoring, to diagnose faults of starter motors in repair and maintenance workshops.
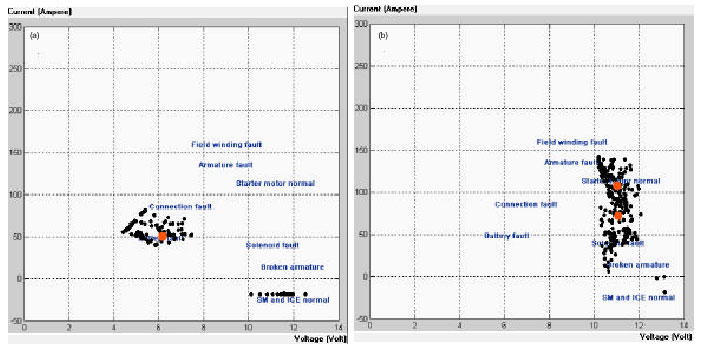 | |
| Fig. 8: | Diagnosis results of fault diagnosis software (a) correct classification result (battery fault) and (b) wrong classification result (starter motor is normal and solenoid fault) |
Starter motor manufacturers can also use this system to test their production. In addition, the developed software can be incorporated into industrial computers (PC104) and can be used for real time condition monitoring of faults diagnosis of vehicles.
REFERENCES
- Abu-Mahfouz, I.A., 2005. A comparative study of three artificial neural networks for the detection and classification of gear faults. Int. J. General Syst., 34: 261-277.
CrossRef - Bassiuny, A.M., L. Xiaoli and R. Du, 2007. Fault diagnosis of stamping process based on empirical mode decomposition and learning vector quantization. Int. J. Mach. Tools Manuf., 47: 2298-2306.
CrossRef - Bay, Ö.F. and R. Bayir, 2005. Kohonen network based fault diagnosis and condition monitoring of pre-engaged starter motor. Int. J. Automotive Tech., 6: 341-350.
Direct Link - Chow, M.Y., R.N. Sharpe and J. Hung, 1993. On the application and design of artificial neural networks for motor fault detection-Part I. IEEE Trans. Ind. Elect., 40: 181-188.
CrossRef - Chow, M.Y., R.N. Sharpe and J. Hung, 1993. On the application and design of artificial neural networks for motor fault detection-Part II. IEEE Trans. Ind. Elect., 40: 189-196.
CrossRef - El-Shafei, A., T.A.F. Hassan, A.K. Soliman, Y. Zeyada and N. Rieger, 2007. Neural network and fuzzy logic diagnostics of 1x faults in rotating machinery. J. Eng. Gas Turbines Power, 129: 703-710.
CrossRef - Finley, W.R. and R.R. Burke, 1994. Troubleshooting motor problems. IEEE Trans. Ind. Applied, 30: 1383-1397.
CrossRef - Hajiaghajani, M., H.A. Toliyat and I.M.S. Panahi, 2004. Advanced fault diagnosis of a dc motor. IEEE. Trans. Ener. Convers., 19: 60-65.
CrossRef - Liu, X.Q., H.Y. Zhang, L. Jun and J. Yang, 2000. Fault detection and diagnosis of permanent-magnet dc motor based on parameter estimation and neural network. IEEE Trans. Ind. Electron., 47: 1021-1030.
CrossRef - Marzi, H., 2004. Real-time fault detection and isolation in industrial machines using learning vector quantization. Proc. Inst. Mech. Eng., Part B J. Eng. Manuf., 218: 949-959.
CrossRef - Selaimia, Y., A. Moussaoui and H.A. Abbassi, 2006. Multi neural networks based approach for fault detection and diagnosis of a DC-Motor. Neural Network World, 16: 369-379.
Direct Link - Vera-Candeas, P., N. Ruiz-Reyes and F. Jurado, 2006. Transient voltage stability and voltage sag discrimination by matching pursuit-based transient modeling and neural networks. Electric Power Components Syst., 34: 321-341.
CrossRef - Wang, C.C. and J.G.P. Too, 2002. Rotating machine fault detection based on HOS and artificial neural networks. J. Int. Manuf., 13: 283-293.
CrossRef - Yang, B.S., T. Han and J.L. An, 2004. ART-KOHONEN neural network for fault diagnosis of rotating machinery. Mech. Syst. Signal Process, 18: 645-657.
CrossRef - Nandi, S. and H.A. Toliyat, 2005. Condition monitoring and fault diagnosis of electrical motors. IEEE Trans. Energy Conversion, 20: 719-729.
CrossRefDirect Link