
Spring C. Hsu
Department of Business Administration, China University of Science and Technology, Taiwan
Information Technology Journal
Year: 2012 | Volume: 11 | Issue: 9 | Page No.: 1193-1201


ABSTRACT
The RFM (recency, frequency and monetary) model has been widely applied for personal customers’ analysis, but limited for the institutional customers. Therefore, the study takes a digital content provider with institutional customers of a variety of Small and Medium Enterprises (SMEs) in Taipei city for RFM clustering and deploys an innovative method combining RFM model and fuzzy c-means (FCM) for analysis. Clustering results suggest that September and October are the two busiest months of transactions for major customers. Moreover, major customers have twice of transactions and total transaction amount of 6,462 USD; i.e., an average transaction amount of 3,231 USD. Consequently, for a digital content provider, the enough staff and equipment preparations must ready before September and October to make sure a high quality service for major customers. The average transaction amount implies that the approximate cost of 3,250 USD is the upper bound of willing to pay for many SMEs. Therefore, to deliver the customized service packages with the charges close to 3,250 USD are the first priority of services development for a digital content provider.
PDF Abstract XML References Citation
Received: November 01, 2011;
Accepted: March 28, 2012;
Published: June 04, 2012
How to cite this article
Spring C. Hsu, 2012. The RFM-based Institutional Customers Clustering: Case Study of a Digital
Content Provider. Information Technology Journal, 11: 1193-1201.
DOI: 10.3923/itj.2012.1193.1201
URL: https://scialert.net/abstract/?doi=itj.2012.1193.1201
DOI: 10.3923/itj.2012.1193.1201
URL: https://scialert.net/abstract/?doi=itj.2012.1193.1201
INTRODUCTION
As the business environment changes from the product-oriented to the customer-oriented to understand the customer behavior is thus becoming more important. The RFM model has been widely applied in many practical areas and showed the ability to profile the customer behaviors (Bhensdadia and Kosta, 2011; Bizhani and Tarokh, 2011; Blattberg et al., 2008; Buttle, 2009; Kohavi and Parekh, 2004; Sekhavat et al., 2010). The RFM method is the popular method used in market segmentation that shows profitable groups of customers. Companies easily find valuable customer behaviors and then develop effectively corresponding marketing strategies by adopting the RFM model.
Literature characterized the general RFM definitions as follows (Hughes, 1994; Stone, 1995; Wei et al., 2010). R is the time of last transaction during an analyzing period and the latest transactions account for the bigger R values. F is the frequency of transactions during an analyzing period and the higher the frequency is, the bigger F will. M is the total amount of spent money during an analyzing period and the much the monetary is, the bigger M will. Chao et al. (2008) indicated that the F and M values are more important for profiling customers. Moreover, Eq. 1 defines the RFM Score, where α, β and γ denote the weights of R, F and M, respectively. For these weights, Hughes (1994) simply regarded the RFM Score with equal weights, but Stone (1995) regarded that the weights are not equal according to different industries:
| (1) |
Some of the variant studies relevant to the RFM model accompanied with neural network methods. However, because of the case-adapted assumptions, these studies showed their limit for general applications (Geyik, 2007; Lee and Hong, 2008). Liu and Shih (2005) tried to rate Customer Lifetime Value (CLV) by the RFM model. Their study clustered customers according to their lifetime value expressed with weighted RFM. However, Li et al. (2006) developed a timely RFM (TRFM) model that conducts the relationship of product properties and purchase periodicity. However, their model is also limited to specific case-adapted assumptions.
Moreover, the clustering methods play important roles to carry out the RFM model. Except for the conventional hierarchical method, the widely applied clustering methods are the k-means and fuzzy c-means (FCM) (Aggelis and Christodoulakis, 2005; Alvarez et al., 2007; Cheng and Chen, 2009; Hamzehei et al., 2011; Hsieh, 2004; Hu and Jing, 2008; Kenesei et al., 2006; Wu et al., 2005; Wu et al., 2009; Zhang et al., 2011). Panda and Patra (2008) indicated that the fuzzy c-means is especially a good choice for circular and spherical clusters. Moreover, Mingoti and Lima (2006) made a comparison for some non-hierarchical and hierarchical clustering algorithms including self-organization map (SOM) neural networks and fuzzy c-means methods. Their results showed that fuzzy c-means had good performance in all cases being stable even in existing of outliers and overlapping and SOM neural network did not do well in almost all cases being influenced by variable and cluster numbers. Similar to Mingoti and Lima’s study, Velmurugan and Santhanam (2010, 2011) also got the conclusions for effectiveness of conducting fuzzy c-means in practical cases. Finally, whatever clustering methods to use, Bose and Chen (2010) indicated that it is important to use multiple techniques for a better clustering.
From the discussions above, it is found that the fuzzy c-means has good performance of clustering. Therefore, this study deployed the fuzzy c-means method for analysis.
MATERIALS AND METHOD
Clustering in brief: The purpose of cluster analysis is to find characteristics that are similar in some data and these data agree these characteristics are divided into several clusters. Therefore, the characteristics in the same cluster are highly homogeneous. General cluster methods are based on the distance as the basis of classification. Data points with high relative distance are regarded more similar and then classified into the same group. Cluster analysis is not a statistical inference technique, but a method to quantify the structural characteristics of a set of data points. Therefore, the clustering does not need any assumptions and generally important concerns of normality and linearity have little influence on the cluster analysis.
The hierarchical and partitioned methods are two major categories in cluster analysis. The partitioned method is to break up the original clusters and re-form new clusters in various stages of clustering. The k-means method is the commonly used partitioned clustering method (Ali et al., 2009; Al-Bashish et al., 2011; Muda et al., 2011). The goal of k-means method is to search the least squared summation of distances for all input data and their corresponding cluster centers. Moreover, to get an initial cluster number for k-means, the two-stage hybrid method is widely used. The first stage applies the hierarchical clustering, mountain clustering, or subtractive clustering to suggest the proper cluster number and then the second stage to deploy the k-means partitioned classification.
FUZZY CLUSTERING
Initializing number of clusters: After the k-means method, a fuzzy based k-means method is proposed as fuzzy c-means method (Alamelumangai and Devishree, 2012; Bezdek, 1981; Dunn, 1973, 1974; Dechang and Xiaolin, 2008; Song et al., 2011; Wei-Yi et al., 2011). Fuzzy c-means is a method of clustering that allows an observation to belong with two or more clusters. This method is often used in pattern recognition. Similar to k-means method, a prior confirmation of cluster number is needed to process the fuzzy c-means method. However, not as the k-means method, the membership of input data points is not clearly belonged to specific clusters in fuzzy c-means method. This study initializes the cluster number via subtractive clustering before conducting fuzzy c-means method. Because subtractive clustering is a fast, one-pass algorithm for estimating the cluster number in a set of data (Abu-Ghoush et al., 2010; Chiu, 1996); and the cluster numbers obtained from the subtractive clustering are usually used to initialize other fuzzy clustering or forecasting methods (Castellanos and James, 2009; Singh and Nagraja, 2011). Moreover, since the subtractive clustering is a commonly used method, this study makes the subtractive clustering directly via the GUI (Graphical User Interface) of mathematical software MATLAB 7.4.
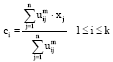
Fuzzy c-means algorithms: Equation 2 represents the objective function J of fuzzy c-means method, where n is the size of data points, k is the cluster number, xj is jth input vector, ci is ith cluster center and uij is point j’s membership of cluster i. In addition, m is fuzziness exponent and usually equal to two (Abraham et al., 2006; Miyamoto et al., 2008):
| (2) |
It is based on minimization of the objective function to do the fuzzy c-means method. Moreover, the procedure of fuzzy c-means algorithm is specified as follows (Celikyilmaz and Turksen, 2009; Mirkin, 2011; Pedrycz, 2007):
| • | Identify cluster number k and initialize the membership function values that satisfy the Eq. 3: |
| (3) |
| • | Calculate the cluster centers by Eq. 4: |
 | (4) |
| • | Calculate the objective function with Eq. 2. This objective function varies from process to process of clustering. The iteration is stopped when goal ε is achieved; otherwise, go to procedure (4) |
| • | Update membership function as Eq. 5 to cluster data under the constraint of Eq. 3. |xj-ci| stands for distance from point j to current cluster center i. |xj-cs| stands for distance from point j to other cluster centers s. After updating the membership function, go back to procedure (2): |
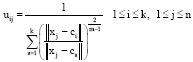 | (5) |
Moreover, this study make the fuzzy c-means clustering via the program code developed by this study and run it in the mathematical software MATLAB 7.4.
THE CASE STUDY
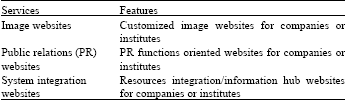
The case-company, DIGITO Technology Co. Ltd., is a digital content provider in Taipei city. With experienced marketing integrators and e-commerce technicians, the company provides application software and a variety of integrated services of inter-net digital content for many SMEs and some large enterprises. Aim to offer customers a one-stop total solution for digital content, major service patterns of the case-company are listed in Table 1.
Customers of the case-company come from a variety of industries, such as entertainment, media, food, furniture and beverages. As the result of complexity of customer composition, finding the core and clear behaviors of customers is thus an important issue to give more suitable services to customers. Therefore, according to the complex operation conditions of the case-company, the fuzzy clustering method is deployed to analyze the customer behaviors of the case-company.
Pre-processing of data: The analyzed raw data concern the time during January 1, 2008 and March 31, 2011, with the total of 273 data points of customers.
| Table 1: | Service patterns of DIGITO technology |
 | |
| Source: Website of DIGITO Technology, 2011 | |
| Table 2: | Fragments of RFM values |
 | |
| Table 3: | Suggested cluster numbers by subtractive clustering |
 | |
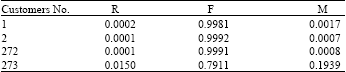
For the pre-processing of the data, the RFM variables are first redefined or calculated as follows.
R is the last transaction date of customers. Since the R value contributes to the RFM scoring determination, a numeric value is necessary. Therefore, R is redefined as the sequential number after the first date of concerned analysis time 2008/1/1 to 2011/3/31. For example, a customer that has conducted last transaction on 2008/1/1 is characterized by R = 1 and the other customer that has conducted last transaction on 2009/1/31 is characterized by R = 366+31 = 397.
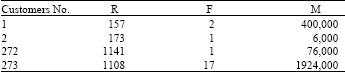
F is the count of transactions the customer conducted within the analysis period. M is the total amount of transaction the customer made within the analysis period. Moreover, RFM Score is summation of R, F and M values. Fragmented samples of the pre-processed R, F and M values are listed in Table 2.
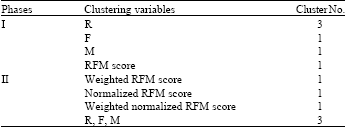
Customers clustering: The two stages clustering process with subtractive clustering and fuzzy c-means are deployed to learn the cluster numbers and then to carry out the clustering. The subtractive clustering function of mathematical software MATLAB 7.4 is used learning the proper cluster numbers. In the subtractive clustering, the influence range is set as 0.5, squash is set as 1.25 and accept and reject ratios are 0.5 and 0.15, respectively. Moreover, to make sure all the important variables or variable sets are not ignored; two phases of subtractive clustering are made, shows as Table 3.
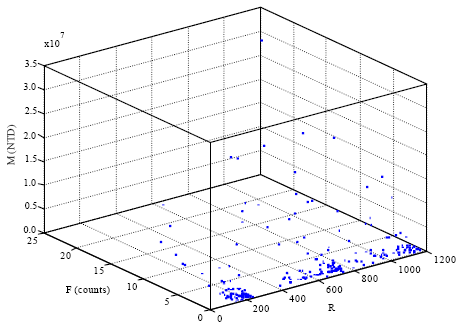 | |
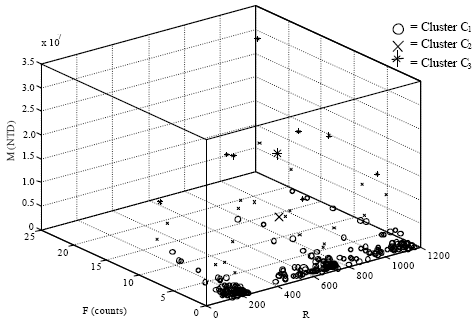
| Fig. 1: | Scatter plot of original RFM data |
In phase-I, individual RFM variables and simple RFM score with equal weights are considered.
The variable R is subtracted into three clusters and the others are subtracted into a cluster. The clustering results of phase-I infers that variable R plays an important role in the case. Accordingly, a new weighted RFM score with weights of α = 3/(3+1+1) = 3/3, β = 1/(3+1+1) = 1/5, γ = 1/(3+1+1) = 1/5 is deployed in phase-II clustering. Meanwhile, to make sure that the inherent different scales of variables R, F and M do not interfere with calculation of RFM scores, a normalized RFM score is also developed in this study. To calculate this normalized RFM score, variables R, F and M are first normalized by Eq. (6), where xj’ denotes rescaled/normalized values of data point xj. Furthermore, a RFM score with normalized data points and different weights is also proposed as “weighted normalized RFM score.” Finally, the clustering with R, F and M three variables together is also made in phase-II. It is concluded from Table 3 that accounts for the variables R, F and M together makes a subtractive clustering suggestion with three clusters. Therefore, it is confirmed that this is the key result that deserved an in-depth analysis:
| (6) |
Consequently, the three variables R, F and M are selected together to make clusters and the scatter plot of original data are shown as Fig. 1.
| Table 4: | Fragments of fuzzy membership values |
 | |
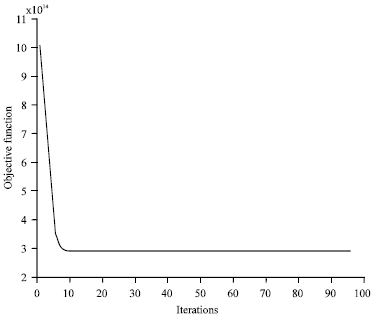
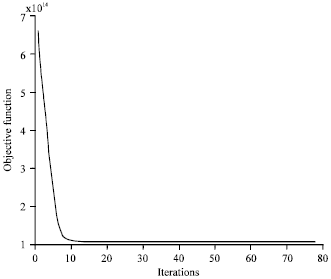
To do the fuzzy clustering, this study writes the fuzzy c-means clustering program codes that executed under the mathematical software MATLAB 7.4. In the fuzzy c-means clustering, exponent for the partition matrix m is set as 2 and least amount of improvement is set as 1e-5. The fuzzy c-means program then runs 98 iterations and converges with the objective function value of 2.88x10¹⁴, Fig. 2. Meanwhile, Table 4 shows fragment of memberships of fuzzy partitioning and the fuzzy clustering results are shown in Table 5. The visualized clustering results are shown in Fig. 3.
However, it is easily to spot an apparent outlier point on the right back corner in Fig. 3. With the corresponding R, F and M values of this outlier point, it is found in the original data set as customer number No. 228 (with the values of R = 1095, F = 22 and M = 31,147,000, respectively). Therefore, it is necessary to remove the outlier from original data set and executes the fuzzy clustering process with the trimmed data set. With the trimmed data set, the program then runs 78 iterations and converges with the objective function value of 1.09x10¹⁴ (Fig. 4).
 | |
| Fig. 2: | Iterations of objective function for original data |
 | |
| Fig. 3: | Clustering and centering plot of original RFM data |
| Table 5: | Clustering outcomes with original RFM data |
 | |
| Note: percentages stand for the data points partitioned to clusters | |
Comparing Fig. 2 with 4, removing the outlier data point facilitates efficiency of the convergence process. Finally, the fuzzy clustering results with trimmed data set are shown in Table 6. The visualized clustering results with trimmed data set are shown in Fig. 5.
 | |
| Fig. 4: | Iterations of objective function for trimmed data |
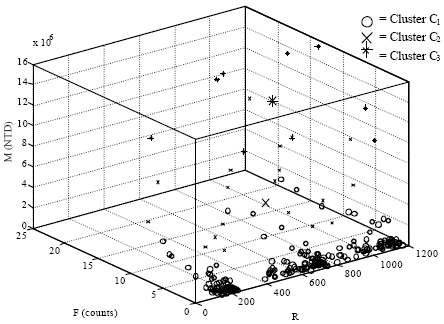 | |
| Fig. 5: | Clustering and centering plot of trimmed RFM data |
| Table 6: | Clustering outcomes with trimmed RFM data |
 | |
| Note: percentages stand for the data points partitioned to clusters | |
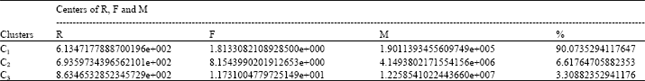
It is now concluded that for the case-company data, the clustering with three variables R, F and M is appropriately portioned into three clusters. Where cluster C1 approximately accounts for 90% of all data (approximate R = 613 = 2009/9/4, F = 2, M = 190,114; i.e., M/F = 95,057), cluster C2 approximately accounts for 7% of all data (approximate R = 694 = 2009/10/24, F = 8, M = 4,149,380; i.e., M/F = 518,673) and cluster C3 approximately accounts for simply 3% of all data (approximate R = 863 = 2010/5/12, F = 12, M = 12,258,541; i.e., M/F = 1,021,545).
In brief, the cluster C1 represents the “major customers” for the case-company. It has the average transactions of two times and average transaction amount of 95 thousand NTD (i.e., 3,231 USD; exchange rate NTD/USD=29.418, March 31, 2011, Central Bank of Taiwan). Moreover, the frequencies show that September and October are the two busiest transaction months of major customers. The cluster C2 represents the “first-minor customers” for the case-company. It has the average transactions of eight times and average transaction amount of 519 thousand NTD (i.e., 17,631 USD). Moreover, the cluster C3 represents the “second-minor customers” for the case-company. It has the average transactions of 12 times and average transaction amount of an million NTD (i.e., 34,725 USD). Observe that, the major customers (i.e., C1) account for 90% of all customers, but making lower contributions to revenues for the case-company. Comparatively, the minor customers (i.e., C2 and C3) account for 10% of all customers, but making higher contributions to revenues for the case-company. Finally, remind that since the case-companyserves many SMEs and few large enterprise customers, the major customers of clustering results consist of SMEs and the minor consist of large enterprises. The results suggest that if the case-company wants to keep or even increase market shares, it should focus on the SMEs, otherwise, if the case-company wants to increase revenues, the large enterprises should be targeted.
CONCLUSIONS
The behaviors of institutional customers are not commonly mentioned in literature. This study analyzes the case-company that mainly provides digital content services to institutional customers. Meanwhile, this study deployed an innovative method combining RFM model and FCM clustering for analyzing the case-company. The analyzed period ranges from January 1, 2008 through March 31, 2011, with originally 273 raw customer data and finally to analyze 272 data after trimming an outlier point. This study deployed the two stages clustering process with subtractive clustering and fuzzy c-means to learn the cluster numbers and then to carry out the clustering via variables of RFM model. This study applied the creative way to decide the weights of RFM scores via importance ranking of R, F and M subtractive clustering outcomes. Without any assumptions or constraints, the clustering approach of this study effectively and easily makes simultaneously clustering on R, F and M variables.
Three customer categories named “major customers,” “first-minor customers,” and “second-minor customers” are clustered in this study. The major customers account for 90% of all customers, but making lower contributions to revenues for the case-company. Comparatively, the minor customers account for 10% of all customers, but making higher contributions to revenues for the case-company. The major customers of clustering results consist of SMEs and the minor consist of large enterprises. The results suggest that if the case-company wants to keep or even increase market shares, it should focus on the SMEs; otherwise, if the case-company wants to increase revenues, it should target the large enterprises.
Suppose that the major customers are critical to the case-company, it is found that September and October are the two busiest transaction months of major customers. Moreover, the major customers in the case-company have the approximate average transaction amount of 3,231 USD. This study concluded that for a digital content provider, the enough staff and equipment preparations must ready before September and October these two busy months to make sure the high quality service for major customers. Finally, since the average transaction amount is below 3,250 USD, it infers that the cost of 3,250 USD is the upper bound of willing to pay for many SMEs. Therefore, to deliver the customized service packages with the charges close to 3,250 USD are the first priority of services development.
REFERENCES
- Abu-Ghoush, M., M. Samhouri, E. Yaseen and T. Herald, 2010. Fuzzy clustering modeling and evaluation of surface interactions and emulsions of selected wheat protein combined to iota-carrageenan and gum Arabic solutions. J. Food Process Eng., 33: 131-149.
CrossRef - Alamelumangai, N. and J. Devishree, 2012. Automated clustering of cancer cells using fuzzy C means with repulsions in ultrasound images. J. Artif. Intel., 55: 14-25.
CrossRefDirect Link - Ali, S.A., N. Sulaiman, A. Mustapha and N. Mustapha, 2009. K-means clustering to improve the accuracy of decision tree response classification. Inform. Technol. J., 8: 1256-1262.
CrossRefDirect Link - Al-Bashish, D., M. Braik and S. Bani-Ahmad, 2011. Detection and classification of leaf diseases using K-means-based segmentation and neural-networks-based classification. Inform. Technol. J., 10: 267-275.
CrossRefDirect Link - Bhensdadia, C.K. and Y.P. Kosta, 2011. Discovering active and profitable patterns with RFM (recency, frequency and monetary) sequential pattern mining: A constraint based approach. Int. J. Inform. Technol. Knowl. Manage., 4: 27-32.
Direct Link - Bizhani, M. and M.J. Tarokh, 2011. Behavioral rules of bank`s point-of-sale for segments description and scoring prediction. Int. J. Industrial Eng. Comput., 2: 337-350.
Direct Link - Bose, I. and X. Chen, 2010. Exploring business opportunities from mobile services data of customers: An inter-cluster analysis approach. Electron. Commerce Res. Appl., 9: 197-208.
Direct Link - Castellanos, F. and N. James, 2009. Average hourly wind speed forecasting with ANFIS. Proceedings of the 11th Americas Conference on Wind Engineering, June 22-26, 2009, San Juan, Puerto Rico.
Direct Link - Chao, P., H.P. Fu, H.H. Lee and Y.C. Chang, 2008. Identifying the customer profiles for 3C-product retailers: A data mining approach. Int. J. Electron. Bus. Manage., 6: 195-202.
Direct Link - Cheng, C.H. and Y.S. Chen, 2009. Classifying the segmentation of customer value via RFM model and RS theory. Expert Syst. Appl., 36: 4176-4184.
CrossRef - Chiu, S., 1996. Method and software for extracting fuzzy classification rules by subtractive clustering. Proceedings of the 1996 Biennial Conference of the North American Fuzzy Information Processing Society, January 19-22, 1996, Berkeley, CA., pp: 461-465.
CrossRef - Dunn, J.C., 1973. A fuzzy relative of the ISODATA process and its use in detecting compact well-separated clusters. J. Cybernet., 3: 32-57.
CrossRefDirect Link - Dunn, J.C., 1974. Well-separated clusters and optimal fuzzy partitions. J. Cybern., 4: 95-104.
CrossRefDirect Link - Hamzehei, A., M. Fathian, H. Farvaresh and M.R. Gholamian, 2011. A new methodology to study customer electrocardiogram using RFM analysis and clustering. Manage. Sci. Lett., 1: 139-148.
CrossRefDirect Link - Hsieh, N.C., 2004. An integrated data mining and behavioral scoring model for analyzing bank customers. Expert Syst. Appl., 27: 623-633.
Direct Link - Hu, W. and Z. Jing, 2008. Study of customer segmentation for auto services companies based on RFM model. Proceedings of the 5th International Conference on Innovation and Management, December 10-11, 2008, Maastricht, The Netherlands, pp: 734-739.
Direct Link - Lee, C.S. and G.H. Hong, 2008. The intelligent method for identifying customer purchasing pattern changed over a period in time. Int. J. Global Bus., 1: 169-183.
Direct Link - Liu, D.R. and Y.Y. Shih, 2005. Integrating AHP and data mining for product recommendation based on customer lifetime value. Inform. Manage., 42: 387-400.
Direct Link - Mingoti, S.A. and J.O. Lima, 2006. Comparing SOM neural network with fuzzy c-means, K-means and traditional hierarchical clustering algorithms. Eur. J. Operat. Res., 174: 1742-1759.
CrossRefDirect Link - Muda, Z., W. Yassin, M.N. Sulaiman and N.I. Udzir, 2011. A K-means and naive bayes learning approach for better intrusion detection. Inform. Technol. J., 10: 648-655.
CrossRefDirect Link - Dechang, P. and Q. Xiaolin, 2008. A new fuzzy clustering algorithm on association rules for knowledge management. Inform. Technol. J., 7: 119-124.
CrossRefDirect Link - Sekhavat, Y.A., M. Fathian, M.R. Gholamian and S. Alizadeh, 2010. Mining important association rules based on the RFMD technique. Int. J. Data Anal. Tech. Strategies, 2: 1-21.
Direct Link - Song, S., Z. Guo and P. Chen, 2011. Fuzzy document clustering using weighted conceptual model. Inform. Technol. J., 10: 1178-1185.
CrossRefDirect Link - Velmurugan, T. and T. Santhanam, 2010. Performance evaluation of k-means and fuzzy c-means clustering algorithms for statistical distributions of input data points. Eur. J. Scient. Res., 46: 320-330.
Direct Link - Velmurugan, T. and T. Santhanam, 2011. A survey of partition based clustering algorithms in data mining: An experimental approach. Inform. Technol. J., 10: 478-484.
CrossRefDirect Link - Wei, J.T., S.Y. Lin and H.H. Wu, 2010. A review of the application of RFM model. Afr. J. Bus. Manage., 4: 4199-4206.
Direct Link - Wei-Yi, W., L. Zhan-Ming and Z. Guo-Quan, 2011. Novel fuzzy clustering-based image segmentation with simultaneous uneven illumination estimation. Inform. Technol. J., 10: 607-610.
CrossRefDirect Link - Zhang, Y., X. Li, Y. Ye, X. Xu and S. Deng, 2011. Information-theoretic agglomerative K-means. Inform. Technol. J., 10: 2420-2426.
CrossRefDirect Link